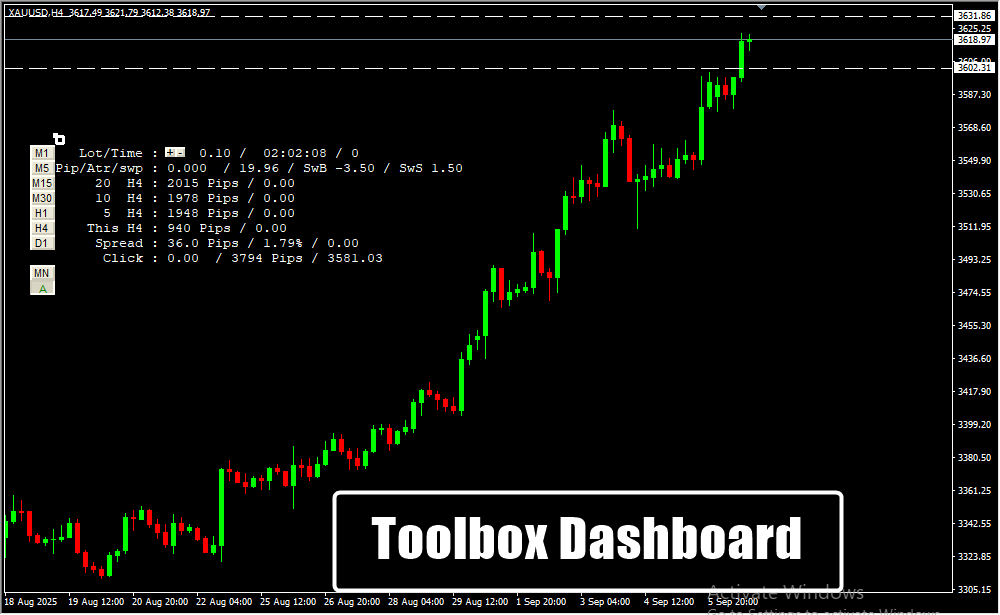
📊 All-in-One Market Overview – Combines multiple indicators into a single, user-friendly dashboard for quick decision-making.
🌐 Monitor Multiple Pairs – View and compare several currency pairs simultaneously to identify trading opportunities efficiently.
⏱️ Multi-Timeframe Analysis – Works on any MT4 timeframe, allowing both short-term and long-term trading strategies.
🔔 Custom Alerts – Receive visual and sound alerts for potential trade setups, ensuring you don’t miss important market movements.
📈 Analyze Trends & Volatility – Quickly assess market trends, current momentum, and volatility to make informed trading decisions.
🛠️ User-Friendly Interface – Easy to read and interpret, suitable for both novice and experienced traders.
💡 Enhances Trading Efficiency – Simplifies technical analysis, helping traders identify profitable opportunities faster.
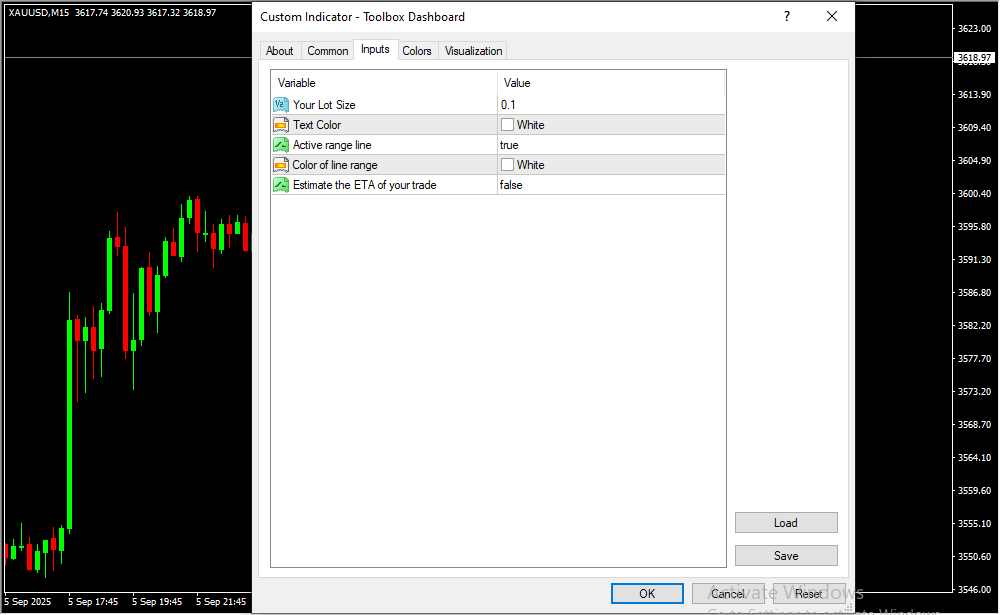

Input Settings & Controls
| Variable | Description |
|---|---|
| 1/2 | Placeholder or default numeric value (can be ignored for documentation). |
| Your Lot Size | The trade lot size used for calculations or display. |
| Text Color | Color of text displayed on the chart (e.g., for labels or info panels). |
| Active range line | Boolean or option to show/hide the active range line on the chart. |
| Color of line range | Color assigned to the active range line. |
| Estimate the ETA of your trade | Option to calculate and display the estimated time of arrival (ETA) or duration of a trade. |
Devices Supported
| Device Type | Operating System | Compatibility with TradingView |
|---|---|---|
| 💻 Windows Laptop/Desktop | Windows XP / Vista / 7 / 8 / 8.1 / 10 / 11 | ✅ Fully supported via app |
| 🍏 MacBook / iMac | macOS 10.15+ | ✅ Fully supported via app |
| 📱 Android / Mobile | Android OS | ❌ Not supported |
Risk Disclaimer
- TrendCharts.in and its associated products, services, software, and tools do not provide any offer or solicitation to buy or sell securities, futures, forex, commodities, or derivatives.
- We are not SEBI Registered Investment Advisors or Research Analysts.
- All materials are strictly for educational, informational, and paper trading & help in analysis purposes only.
- We do not provide advice for Real Money Trade, tips, buy/sell recommendations, or investment strategies.
- TrendCharts is solely involved in the development, sell, resale, and distribution of financial market software, datafeeds, indicators, scanners, and tools.
- All our offerings are intended for testing strategies and educational evaluation only—not for real-money trading.
- Users may utilize the software and tools for paper trading or strategy evaluation only.
- If users apply our offerings to actual trading (knowingly or unknowingly), TrendCharts.in or its stakeholders bear no responsibility for any profit or loss.
- Any such use is at the user’s sole discretion and risk.
- We explicitly disclaim liability for any financial loss, trading loss, or damages resulting from:
- Use of our software, tools, or services.
- Decisions made based on any charts, indicators, AFLs, data, or analysis from our products.
- All market data and content provided are subject to delays, inaccuracies, or errors.
- Past performance (actual or hypothetical) is not indicative of future results.
- Hypothetical or backtested performance may not reflect the impact of actual market conditions.
- Trading and investing involve substantial financial risk and can result in loss of capital beyond the initial investment.
- Users must use individual discretion and independent judgment while interpreting signals, strategies, or chart setups.
- Automated signals or scanners are tools for evaluation—not trading instructions.
- TrendCharts content does not account for personal financial conditions, goals, or investment profile.
- Before making any financial decisions, consult with a licensed financial advisor or SEBI-registered professional.
- Do not rely solely on any information presented on our site for actual trades.
- Datafeeds and information may be delayed as per data vendor policies or exchange requirements.
- We do not guarantee the real-time accuracy, timeliness, or completeness of such data.
- No legal claim may be made against us or our data providers based on inaccuracies.
- Any user testimonials are individual opinions and may not represent the typical user experience.
- Hypothetical performance results involve inherent limitations and should not be relied upon for real-money decisions.
- All opinions, data, signals, and analyses shared on the website are subject to change without notice.
- TrendCharts reserves the right to modify tools, content, and services at its discretion.
- Our software or product names are for branding purposes only and do not imply any market prediction or financial guarantee.
- No claim is made regarding profitability from any software usage.
- All content—charts, indicators, tools, or data—is designed for testing, analysis, and learning.
- No real-money trading or investment recommendations are provided or supported.
 Final Note: Trading in financial markets is speculative and may not be suitable for all investors. TrendCharts.in provides various automatic signal setups for Paper Trading & help in Analysis, it is not a “black box” system to be used without careful evaluation. Users must apply their judgment in filtering automated setups, particularly in relation to broader market trends. All trading decisions are solely the responsibility of the individual trader. Trading and investing involve risks, and losses are inevitable, So Kindly use only risk capital and never invest money you cannot afford to lose.
 Always remember
 my 3R Rule
 : If the money
 is yours then, risk
 , reward
 and regret
 are solely yours.