Take Profit & Stop Loss Calculator Indicator

  • MT4 TP/SL Calculator
  • Visual Risk Management Tool
  • Quick Trade Setup Planner
  • Accurate R/R Ratio Display
  • Multi-Market Position Manager

📌 Overview

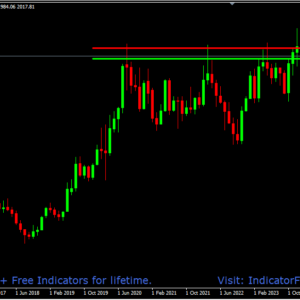
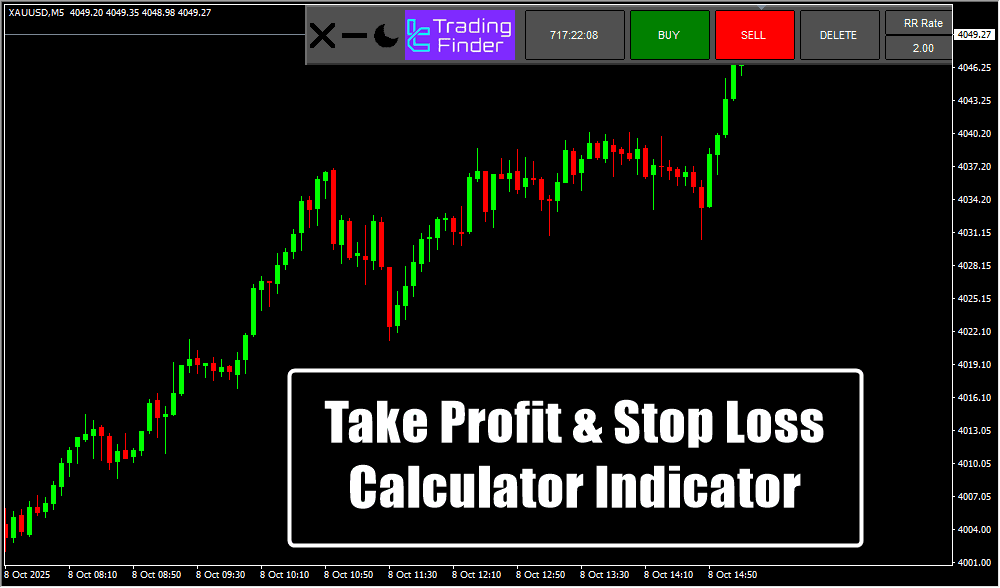
  • Calculates and displays take profit (TP) and stop loss (SL) levels directly on the chart.

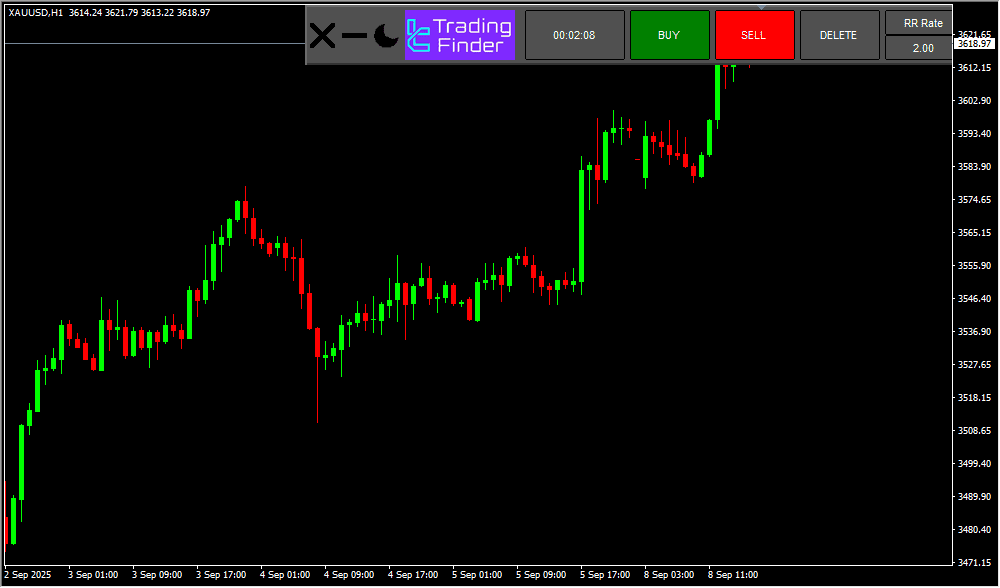
  • Includes a dedicated trade management box for configuring buy/sell setups.

  • Automatically computes profit, loss, and R/R ratio for every trade.

  • Shows remaining time for the next candle (Time to next bar).

  • Suitable for forex, stocks, crypto, indices, and commodities.


📌 Core Features

  • Visual lines for Open Position (gray), TP (green), and SL (red).

  • Adjustable TP and SL by dragging lines or by entering R/R.

  • Allows manual lot size input using “Lot Rate”.

  • Multi-timeframe support on all MT4 charts.

  • Dedicated Buy and Sell setup sections.

  • Provides clean, user-friendly risk management for beginners and pros.


📌 Buy Position Example

  • In a USD/CAD 1H uptrend, TP is placed above the entry and SL below.

  • Indicator shows:

    • R/R ratio

    • Volume (lots)

    • Remaining candle time

  • Helps confirm TP/SL alignment with trend conditions.


📌 Sell Position Example

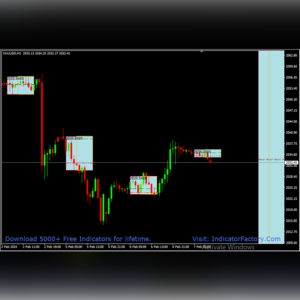
  • On ETH/USD 30M downtrend, TP is positioned below and SL above entry.

  • Indicator displays R/R, volume, and trade direction clearly.

  • Ensures disciplined risk planning in bearish markets.


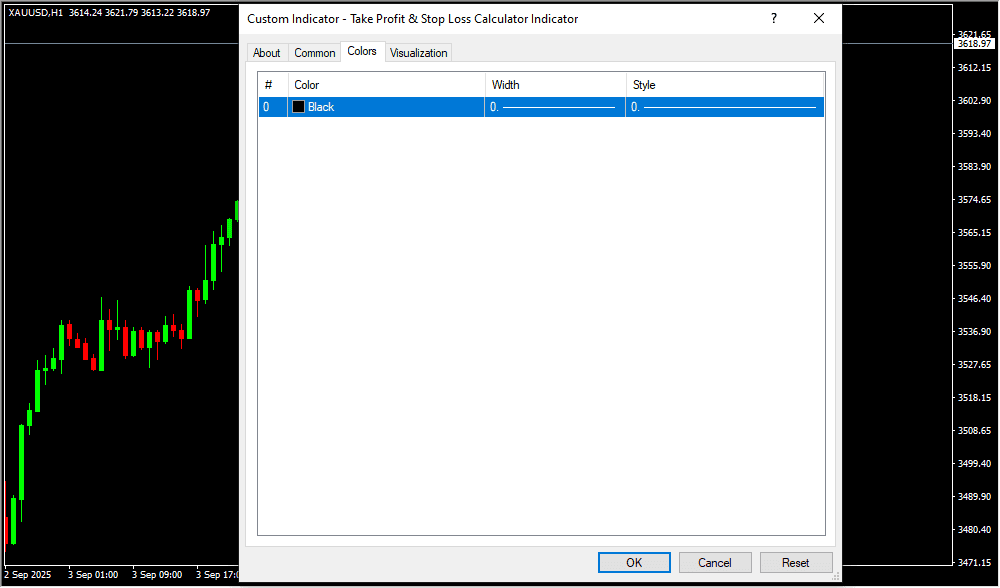
📌 Settings & Customization

  • Light/Dark Theme: Customize TP/SL colors.

  • Time to Next Bar: View candle countdown.

  • Buy/Sell Configuration: Modify TP/SL for each direction.

  • Delete: Remove all lines instantly.

  • R/R Rate: Set desired risk-to-reward.

  • Lot Rate: Define trade volume manually.


📌 Why Traders Use It

  • Makes TP/SL planning fast, visual, and accurate.

  • Eliminates manual calculation errors.

  • Improves consistency in risk management.

  • Supports scalpers, intraday traders, and swing traders.

  • Functions perfectly across crypto, forex, stocks, commodities, and indices.


📌 Conclusion

  • A complete trade management and R/R calculation tool for MT4.

  • Lets traders set TP and SL through drag-and-drop lines or R/R input.

  • Enhances clarity, discipline, and precision in all trading conditions.

Input Settings & Controls

Color

Defines the visual color used for drawing or displaying the selected element on the chart.

Width

Specifies the thickness of the drawn line, border, or object.

Style

Determines the line or object style (such as solid, dashed, dotted) used for visual representation.

#

Represents a placeholder or label for grouping settings related to color, width, and style.

Devices Supported

Device Type Operating System Compatibility with TradingView
💻 Windows Laptop/Desktop Windows XP / Vista / 7 / 8 / 8.1 / 10 / 11 ✅ Fully supported via app
🍏 MacBook / iMac macOS 10.15+ ✅ Fully supported via app
📱 Android / Mobile Android OS ❌ Not supported

Risk Disclaimer

  • TrendCharts.in and its associated products, services, software, and tools do not provide any offer or solicitation to buy or sell securities, futures, forex, commodities, or derivatives.
  • We are not SEBI Registered Investment Advisors or Research Analysts.
  • All materials are strictly for educational, informational, and paper trading & help in analysis purposes only.
  • We do not provide advice for Real Money Trade, tips, buy/sell recommendations, or investment strategies.
  • TrendCharts is solely involved in the development, sell, resale, and distribution of financial market software, datafeeds, indicators, scanners, and tools.
  • All our offerings are intended for testing strategies and educational evaluation only—not for real-money trading.
  • Users may utilize the software and tools for paper trading or strategy evaluation only.
  • If users apply our offerings to actual trading (knowingly or unknowingly), TrendCharts.in or its stakeholders bear no responsibility for any profit or loss.
  • Any such use is at the user’s sole discretion and risk.
  • We explicitly disclaim liability for any financial loss, trading loss, or damages resulting from:
  • Use of our software, tools, or services.
  • Decisions made based on any charts, indicators, AFLs, data, or analysis from our products.
  • All market data and content provided are subject to delays, inaccuracies, or errors.
  • Past performance (actual or hypothetical) is not indicative of future results.
  • Hypothetical or backtested performance may not reflect the impact of actual market conditions.
  • Trading and investing involve substantial financial risk and can result in loss of capital beyond the initial investment.
  • Users must use individual discretion and independent judgment while interpreting signals, strategies, or chart setups.
  • Automated signals or scanners are tools for evaluation—not trading instructions.
  • TrendCharts content does not account for personal financial conditions, goals, or investment profile.
  • Before making any financial decisions, consult with a licensed financial advisor or SEBI-registered professional.
  • Do not rely solely on any information presented on our site for actual trades.
  • Datafeeds and information may be delayed as per data vendor policies or exchange requirements.
  • We do not guarantee the real-time accuracy, timeliness, or completeness of such data.
  • No legal claim may be made against us or our data providers based on inaccuracies.
  • Any user testimonials are individual opinions and may not represent the typical user experience.
  • Hypothetical performance results involve inherent limitations and should not be relied upon for real-money decisions.
  • All opinions, data, signals, and analyses shared on the website are subject to change without notice.
  • TrendCharts reserves the right to modify tools, content, and services at its discretion.
  • Our software or product names are for branding purposes only and do not imply any market prediction or financial guarantee.
  • No claim is made regarding profitability from any software usage.
  • All content—charts, indicators, tools, or data—is designed for testing, analysis, and learning.
  • No real-money trading or investment recommendations are provided or supported.

⚠️ Final Note: Trading in financial markets is speculative and may not be suitable for all investors. TrendCharts.in provides various automatic signal setups for Paper Trading & help in Analysis, it is not a “black box” system to be used without careful evaluation. Users must apply their judgment in filtering automated setups, particularly in relation to broader market trends. All trading decisions are solely the responsibility of the individual trader. Trading and investing involve risks, and losses are inevitable, So Kindly use only risk capital and never invest money you cannot afford to lose.

✅ Always remember🧠 my 3R Rule💡: If the money💰 is yours then, risk⚖️, reward🏆 and regret😔 are solely yours. 🔥

Related Products

Scroll to Top

Contact US

Fill out the form below, and we will be in touch shortly.
Contact Information