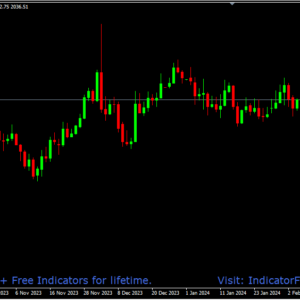
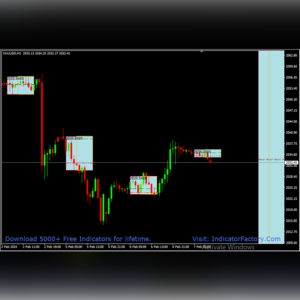
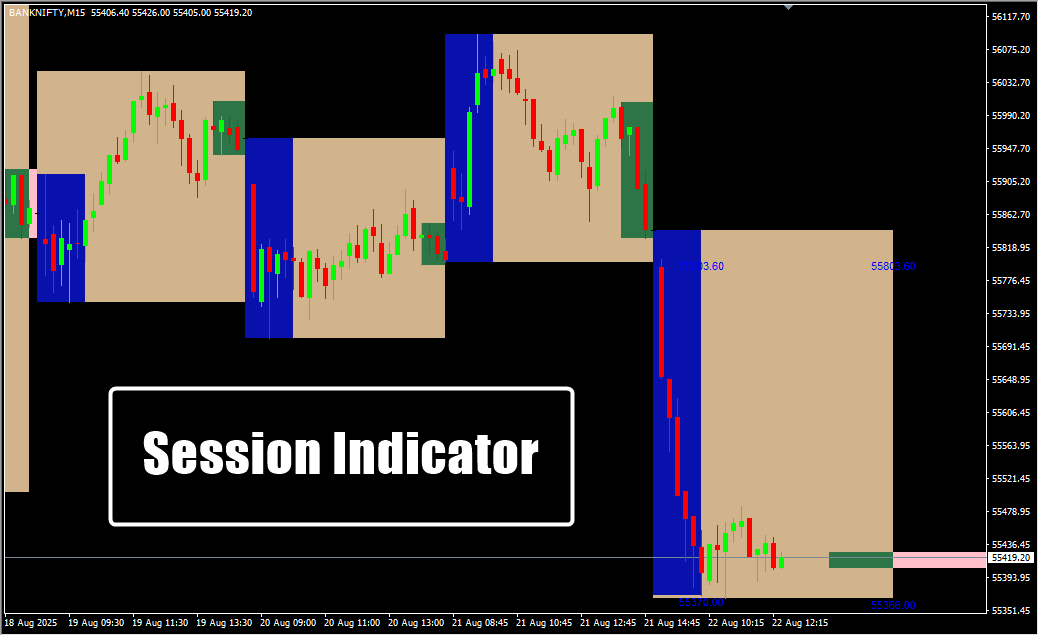
📌 Visual Session Boxes – Draws boxes for Asian, London, and New York trading sessions on the main chart.
📌 Customizable Colors – Allows traders to assign different colors for each trading session for easy identification.
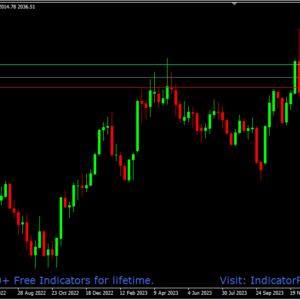
📌 High & Low Levels – Displays the lowest and highest prices reached during each session.
📌 Adjustable Session Times – Session start and end times can be customized to match trader preferences or time zones.
📌 Multi-Timeframe Support – Suitable for all timeframes on MT4, offering flexibility for short-term and long-term traders.
📌 Enhanced Market Analysis – Helps traders quickly visualize market activity and volatility during each session.
📌 Trader-Friendly Tool – Provides clear, easy-to-read session data without cluttering the chart.
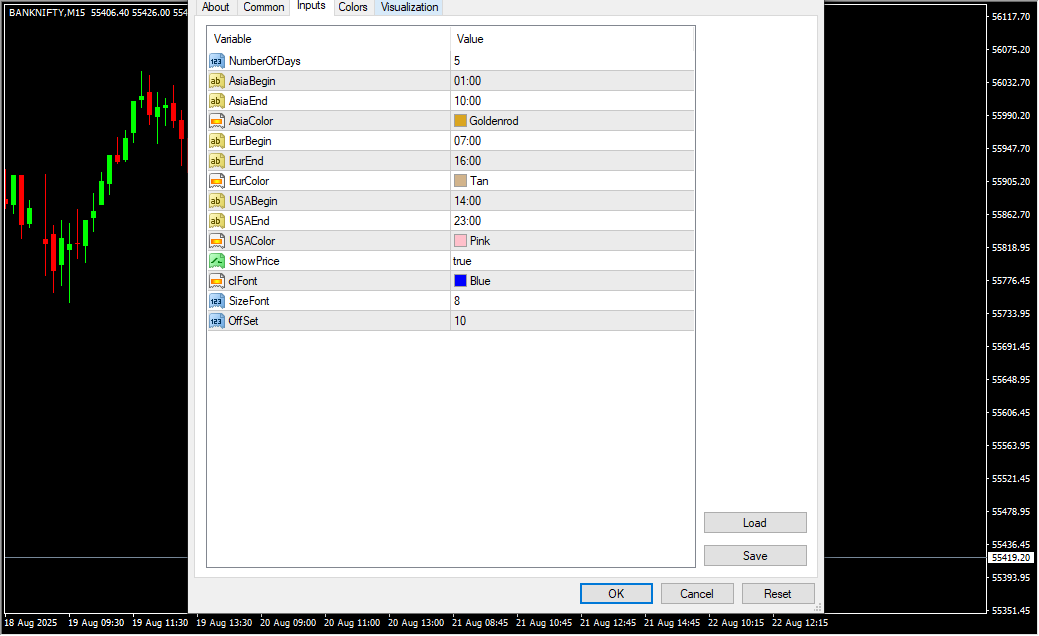
Input Settings & Controls
-
Number of Days – Determines how many past days’ sessions are displayed on the chart.
-
Session Start and End Times – Allows traders to define the exact start and end times for Asian, European, and USA sessions.
-
Session Colors – Customizes the color for each session box to easily distinguish between sessions visually.
-
Show Prices – Option to display the highest and lowest prices reached during each session.
-
Font Settings – Adjusts the color and size of session price labels for clarity.
-
Offset – Controls the distance between the session box and price labels to prevent overlap.
Devices Supported
| Device Type | Operating System | Compatibility with TradingView |
|---|---|---|
| 💻 Windows Laptop/Desktop | Windows XP / Vista / 7 / 8 / 8.1 / 10 / 11 | ✅ Fully supported via app |
| 🍏 MacBook / iMac | macOS 10.15+ | ✅ Fully supported via app |
| 📱 Android / Mobile | Android OS | ❌ Not supported |
Risk Disclaimer
- TrendCharts.in and its associated products, services, software, and tools do not provide any offer or solicitation to buy or sell securities, futures, forex, commodities, or derivatives.
- We are not SEBI Registered Investment Advisors or Research Analysts.
- All materials are strictly for educational, informational, and paper trading & help in analysis purposes only.
- We do not provide advice for Real Money Trade, tips, buy/sell recommendations, or investment strategies.
- TrendCharts is solely involved in the development, sell, resale, and distribution of financial market software, datafeeds, indicators, scanners, and tools.
- All our offerings are intended for testing strategies and educational evaluation only—not for real-money trading.
- Users may utilize the software and tools for paper trading or strategy evaluation only.
- If users apply our offerings to actual trading (knowingly or unknowingly), TrendCharts.in or its stakeholders bear no responsibility for any profit or loss.
- Any such use is at the user’s sole discretion and risk.
- We explicitly disclaim liability for any financial loss, trading loss, or damages resulting from:
- Use of our software, tools, or services.
- Decisions made based on any charts, indicators, AFLs, data, or analysis from our products.
- All market data and content provided are subject to delays, inaccuracies, or errors.
- Past performance (actual or hypothetical) is not indicative of future results.
- Hypothetical or backtested performance may not reflect the impact of actual market conditions.
- Trading and investing involve substantial financial risk and can result in loss of capital beyond the initial investment.
- Users must use individual discretion and independent judgment while interpreting signals, strategies, or chart setups.
- Automated signals or scanners are tools for evaluation—not trading instructions.
- TrendCharts content does not account for personal financial conditions, goals, or investment profile.
- Before making any financial decisions, consult with a licensed financial advisor or SEBI-registered professional.
- Do not rely solely on any information presented on our site for actual trades.
- Datafeeds and information may be delayed as per data vendor policies or exchange requirements.
- We do not guarantee the real-time accuracy, timeliness, or completeness of such data.
- No legal claim may be made against us or our data providers based on inaccuracies.
- Any user testimonials are individual opinions and may not represent the typical user experience.
- Hypothetical performance results involve inherent limitations and should not be relied upon for real-money decisions.
- All opinions, data, signals, and analyses shared on the website are subject to change without notice.
- TrendCharts reserves the right to modify tools, content, and services at its discretion.
- Our software or product names are for branding purposes only and do not imply any market prediction or financial guarantee.
- No claim is made regarding profitability from any software usage.
- All content—charts, indicators, tools, or data—is designed for testing, analysis, and learning.
- No real-money trading or investment recommendations are provided or supported.
 Final Note: Trading in financial markets is speculative and may not be suitable for all investors. TrendCharts.in provides various automatic signal setups for Paper Trading & help in Analysis, it is not a “black box” system to be used without careful evaluation. Users must apply their judgment in filtering automated setups, particularly in relation to broader market trends. All trading decisions are solely the responsibility of the individual trader. Trading and investing involve risks, and losses are inevitable, So Kindly use only risk capital and never invest money you cannot afford to lose.
 Always remember
 my 3R Rule
 : If the money
 is yours then, risk
 , reward
 and regret
 are solely yours.