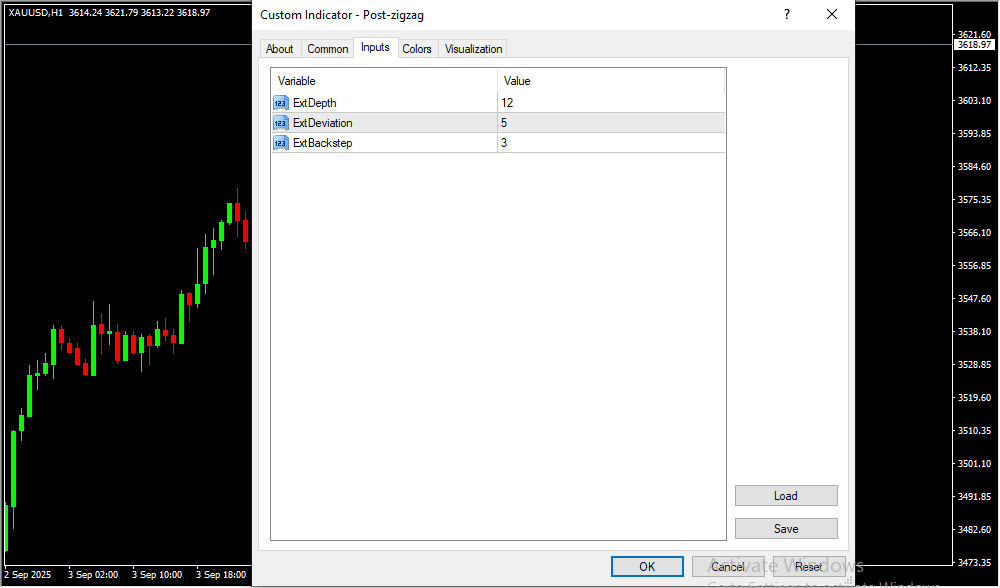
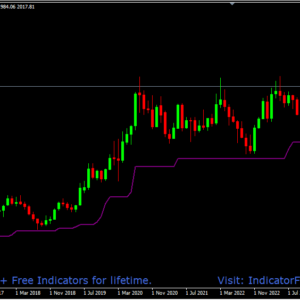
The Post Zigzag MT4 Indicator is designed to simplify price action by connecting significant highs and lows with clean, straight lines. Unlike other indicators that focus on volume or momentum, this tool offers a crystal-clear visual of market waves. By filtering out minor fluctuations, it helps traders focus on the bigger picture — making it easier to identify where the market has been and where it might be heading next.
⚡ Why Traders Use It
Traders rely on the Post Zigzag Indicator because it reveals the underlying market structure at a glance. It highlights major swing points that form the foundation of chart patterns like double tops, double bottoms, and head-and-shoulders formations. Technical traders find it extremely useful for:
-
Identifying trend direction and reversals.
-
Determining accurate stop-loss and take-profit levels.
-
Measuring price swings to project future targets.
By visually organizing price movements, the indicator helps reduce confusion and keeps traders focused on key turning points.
🎯 How It Improves Trading Decisions
The Post Zigzag MT4 Indicator does not attempt to predict the future — instead, it delivers clarity. By cutting through the noise and showing only meaningful swings, it allows traders to analyze the market with greater confidence.
When combined with tools like Fibonacci retracements, trendlines, or moving averages, the Zigzag indicator becomes a powerful component of any trading strategy, making it easier to confirm entries and exits with higher precision.
🧠 Practical Application
-
Day Traders: Identify intraday swing points and short-term reversals.
-
Swing Traders: Spot larger market structures and trend shifts with ease.
-
Position Traders: Track long-term direction and key reversal zones.
No matter your style, this indicator turns messy charts into structured, easy-to-read visuals — ideal for traders who value simplicity and accuracy.
📈 How to Trade with the Post Zigzag MT4 Indicator
Buy Setup
-
Wait for the Zigzag line to form a clear swing low (bottom turning point).
-
Confirm that the next Zigzag leg is moving upward.
-
Enter a buy trade when the price closes above the previous swing low.
-
Place a stop-loss just below the most recent Zigzag low.
-
Take profit near the next projected swing high or trail your stop.
Sell Setup
-
Wait for the Zigzag line to form a clear swing high (top turning point).
-
Confirm that the next Zigzag leg is moving downward.
-
Enter a sell trade when the price closes below the previous swing high.
-
Place a stop-loss just above the most recent Zigzag high.
-
Take profit near the next projected swing low or use a trailing stop.
🏁 Conclusion
The Post Zigzag MT4 Indicator is a must-have for traders who want a clear view of price structure without unnecessary noise. It helps you visualize trends, reversals, and key patterns quickly — turning raw price data into actionable insights. Whether you’re a beginner learning market structure or a professional refining your strategy, this tool enhances clarity, confidence, and precision in every trade.
Risk Disclaimer
- TrendCharts.in and its associated products, services, software, and tools do not provide any offer or solicitation to buy or sell securities, futures, forex, commodities, or derivatives.
- We are not SEBI Registered Investment Advisors or Research Analysts.
- All materials are strictly for educational, informational, and paper trading & help in analysis purposes only.
- We do not provide advice for Real Money Trade, tips, buy/sell recommendations, or investment strategies.
- TrendCharts is solely involved in the development, sell, resale, and distribution of financial market software, datafeeds, indicators, scanners, and tools.
- All our offerings are intended for testing strategies and educational evaluation only—not for real-money trading.
- Users may utilize the software and tools for paper trading or strategy evaluation only.
- If users apply our offerings to actual trading (knowingly or unknowingly), TrendCharts.in or its stakeholders bear no responsibility for any profit or loss.
- Any such use is at the user’s sole discretion and risk.
- We explicitly disclaim liability for any financial loss, trading loss, or damages resulting from:
- Use of our software, tools, or services.
- Decisions made based on any charts, indicators, AFLs, data, or analysis from our products.
- All market data and content provided are subject to delays, inaccuracies, or errors.
- Past performance (actual or hypothetical) is not indicative of future results.
- Hypothetical or backtested performance may not reflect the impact of actual market conditions.
- Trading and investing involve substantial financial risk and can result in loss of capital beyond the initial investment.
- Users must use individual discretion and independent judgment while interpreting signals, strategies, or chart setups.
- Automated signals or scanners are tools for evaluation—not trading instructions.
- TrendCharts content does not account for personal financial conditions, goals, or investment profile.
- Before making any financial decisions, consult with a licensed financial advisor or SEBI-registered professional.
- Do not rely solely on any information presented on our site for actual trades.
- Datafeeds and information may be delayed as per data vendor policies or exchange requirements.
- We do not guarantee the real-time accuracy, timeliness, or completeness of such data.
- No legal claim may be made against us or our data providers based on inaccuracies.
- Any user testimonials are individual opinions and may not represent the typical user experience.
- Hypothetical performance results involve inherent limitations and should not be relied upon for real-money decisions.
- All opinions, data, signals, and analyses shared on the website are subject to change without notice.
- TrendCharts reserves the right to modify tools, content, and services at its discretion.
- Our software or product names are for branding purposes only and do not imply any market prediction or financial guarantee.
- No claim is made regarding profitability from any software usage.
- All content—charts, indicators, tools, or data—is designed for testing, analysis, and learning.
- No real-money trading or investment recommendations are provided or supported.
 Final Note: Trading in financial markets is speculative and may not be suitable for all investors. TrendCharts.in provides various automatic signal setups for Paper Trading & help in Analysis, it is not a “black box” system to be used without careful evaluation. Users must apply their judgment in filtering automated setups, particularly in relation to broader market trends. All trading decisions are solely the responsibility of the individual trader. Trading and investing involve risks, and losses are inevitable, So Kindly use only risk capital and never invest money you cannot afford to lose.
 Always remember
 my 3R Rule
 : If the money
 is yours then, risk
 , reward
 and regret
 are solely yours.