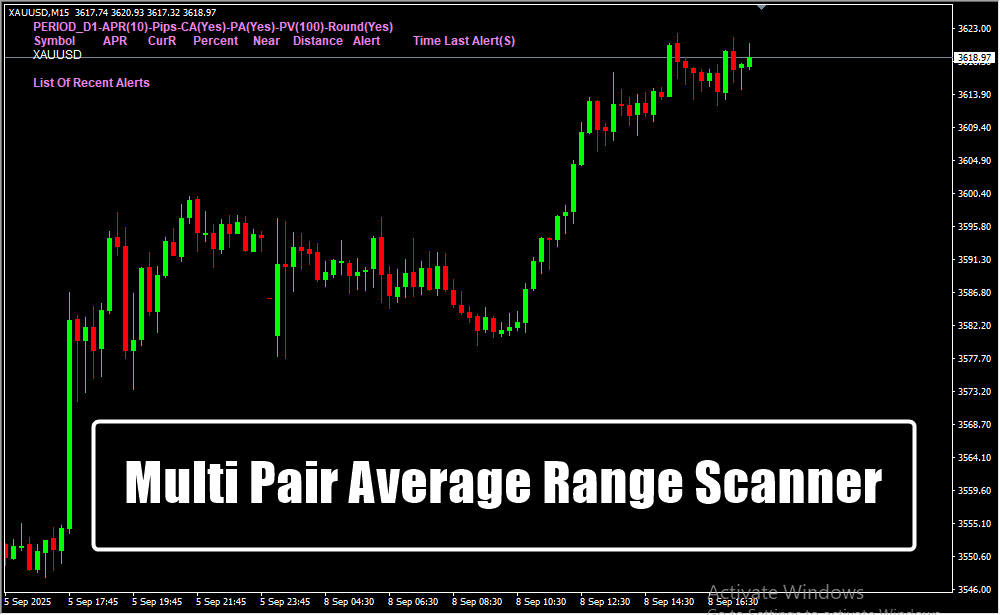
⚡ Multi-Pair Analysis – Scan multiple currency pairs simultaneously for efficiency.
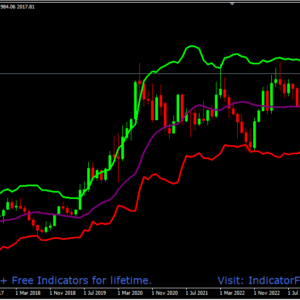
📈 Average Range Calculation – Compares current range with historical average range.
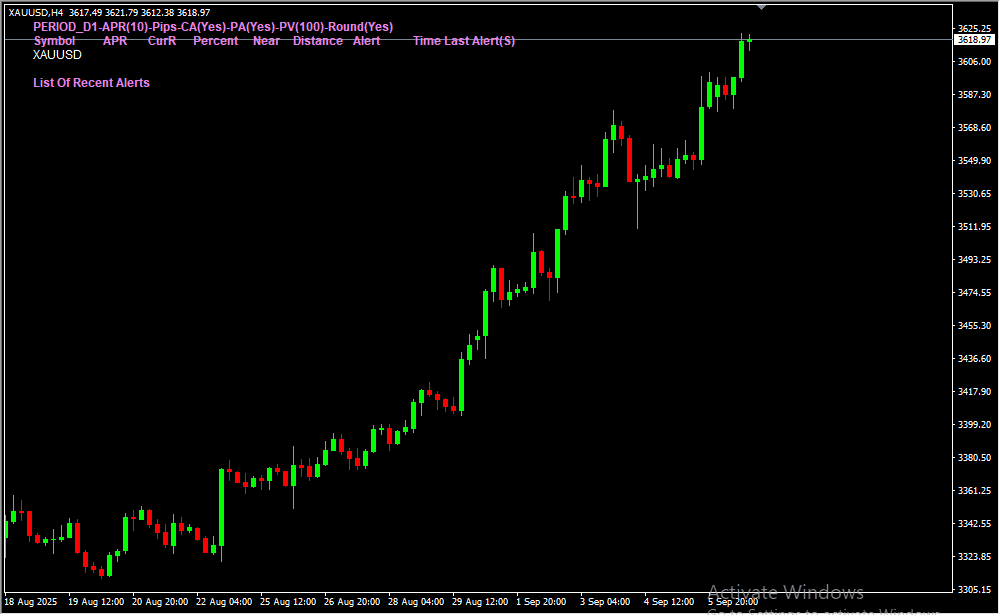
🔄 Trend Identification – Current range above average indicates an upward trend; below average indicates a downward trend.
🔍 Correlation Insights – Shows which pairs are moving together or in opposite directions.
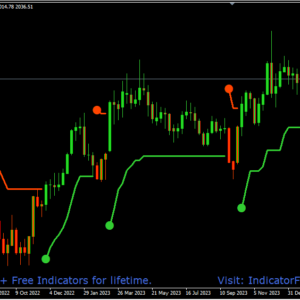
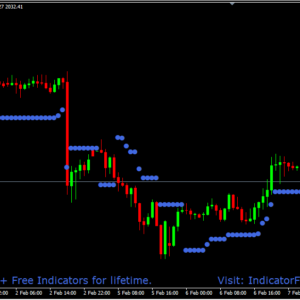
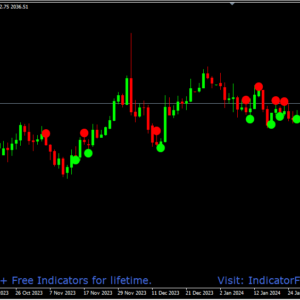
🎯 Spot Trading Opportunities – Helps traders make informed decisions on entries and exits.
⏱️ Multi-Timeframe Compatible – Suitable for both short-term and long-term trading strategies.
💡 User-Friendly Tool – Simple interface for both beginners and experienced traders.
⚡ Boost Trading Performance – Quickly assess multiple pairs to improve trading efficiency.
🛠️ Easy Installation – Download and apply on MT4 in a few clicks.
Input Settings & Controls
| Variable | Description |
|---|---|
| Window | Defines the chart window or sub-window where the panel will be displayed. |
| Comer | Sets the corner of the chart window where the panel will be anchored. |
| Back GroundColor | Background color of the panel. |
| Sorted Display | Controls whether panel info is displayed in sorted order. |
| X.position | Horizontal offset from the selected corner. |
| Y.position | Vertical offset from the selected corner. |
| PanelColor2 | Secondary color for panel styling (borders/rows). |
| PanelColor3 | Tertiary color for highlights or gradients. |
| Time Frame | Chart timeframe used for calculations (M1, H1, etc.). |
| Amplitude | Depth/period used in channel or signal calculations. |
| ChannelDeviation | Width of channel lines from central value. |
| alertsOn | Enables/disables alerts. |
| alertsOnCurrent | Alerts on current (open) bar instead of closed bar. |
| alerts Message | Enables popup/text alerts. |
| alerts Sound | Enables sound alerts. |
| alerts Email | Enables email alerts. |
| ShowChannels | Toggles visibility of channel lines. |
| Show Arrows | Toggles visibility of arrows on chart. |
| ArrowsOn First Bar | Shows arrows on the first bar immediately. |
| SD_MaxMin_Range | Max–min range used in volatility calculations. |
| MODE_MA | Type of Moving Average (SMA, EMA, etc.). |
| PRICE_TYPE | Price used for calculation (Close, Open, High, etc.). |
| ma TrendPeriodv_1 | Short-term MA trend period. |
| ma TrendPeriodv_2 | Medium-term MA trend period. |
| ma TrendPeriodv_3 | Longer-term MA trend period. |
| ma TrendPeriodv_4 | Additional MA trend period (confirmation). |
| Auto Refresh | Enables auto-refresh of indicator values. |
| History | Number of past bars used in calculation. |
| PrPeriod | Period used for price-based calculation. |
| PrMode | Calculation mode (standard, smoothed, etc.). |
| PrPrice | Price type used (Close, Open, etc.). |
| FutureK | Forward shift for lines/signals. |
| Show Dodji | Toggles Doji candlestick display. |
| Chart AboveIndik | Draws chart candles above indicator objects. |
| ClockColor | Color of countdown timer/clock. |
| PriceColor | Color of price label or line. |
| CPFont | Font type for Current Price label. |
| CP Size | Font size for Current Price. |
| CP Shift | Position shift for Current Price label. |
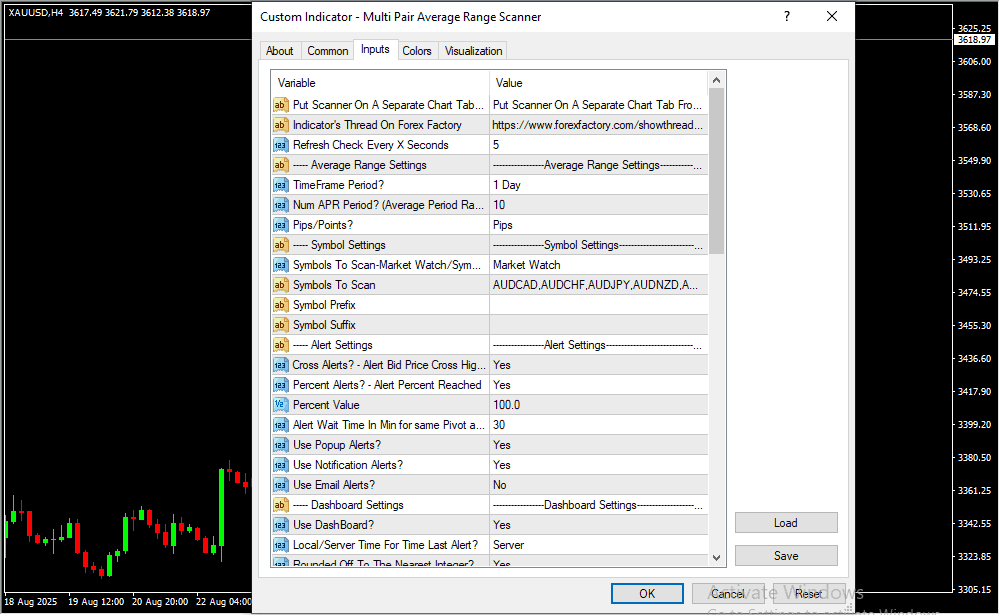
| Put Scanner On A Separate Chart Tab … | Loads scanner in a separate chart tab. |
| Indicator’s Thread On Forex Factory | Reference to indicator’s Forex Factory thread. |
| Refresh Check Every X Seconds | Interval for refreshing scanner data. |
| Time Frame Period? | Timeframe for average range calculation. |
| Num APR Period? (Average Period Range) | Number of periods used for average range. |
| Pips/Points? | Measure range in pips or points. |
| Symbols To Scan – Market Watch / Symbol List | Source of symbols to scan (Market Watch or custom list). |
| Symbols To Scan | Specific list of symbols to be scanned. |
| Symbol Prefix | Prefix text for broker symbol naming. |
| Symbol Suffix | Suffix text for broker symbol naming. |
| Cross Alerts? – Alert Bid Price Cross High/Low | Alerts when bid crosses predefined levels. |
| Percent Alerts? – Alert Percent Reached | Alerts when a % threshold is reached. |
| Percent Value | Percentage threshold for alerts. |
| Alert Wait Time In Min for same Pivot alert | Delay between repeated alerts on same pivot. |
| Use Popup Alerts? | Enables pop-up alerts. |
| Use Notification Alerts? | Enables mobile push notifications. |
| Use Email Alerts? | Enables email alerts. |
| Use Dash Board? | Toggles on-screen dashboard. |
| Local/Server Time For Time Last Alert? | Shows last alert time in local or server time. |
Devices Supported
| Device Type | Operating System | Compatibility with TradingView |
|---|---|---|
| 💻 Windows Laptop/Desktop | Windows XP / Vista / 7 / 8 / 8.1 / 10 / 11 | ✅ Fully supported via app |
| 🍏 MacBook / iMac | macOS 10.15+ | ✅ Fully supported via app |
| 📱 Android / Mobile | Android OS | ❌ Not supported |
Risk Disclaimer
- TrendCharts.in and its associated products, services, software, and tools do not provide any offer or solicitation to buy or sell securities, futures, forex, commodities, or derivatives.
- We are not SEBI Registered Investment Advisors or Research Analysts.
- All materials are strictly for educational, informational, and paper trading & help in analysis purposes only.
- We do not provide advice for Real Money Trade, tips, buy/sell recommendations, or investment strategies.
- TrendCharts is solely involved in the development, sell, resale, and distribution of financial market software, datafeeds, indicators, scanners, and tools.
- All our offerings are intended for testing strategies and educational evaluation only—not for real-money trading.
- Users may utilize the software and tools for paper trading or strategy evaluation only.
- If users apply our offerings to actual trading (knowingly or unknowingly), TrendCharts.in or its stakeholders bear no responsibility for any profit or loss.
- Any such use is at the user’s sole discretion and risk.
- We explicitly disclaim liability for any financial loss, trading loss, or damages resulting from:
- Use of our software, tools, or services.
- Decisions made based on any charts, indicators, AFLs, data, or analysis from our products.
- All market data and content provided are subject to delays, inaccuracies, or errors.
- Past performance (actual or hypothetical) is not indicative of future results.
- Hypothetical or backtested performance may not reflect the impact of actual market conditions.
- Trading and investing involve substantial financial risk and can result in loss of capital beyond the initial investment.
- Users must use individual discretion and independent judgment while interpreting signals, strategies, or chart setups.
- Automated signals or scanners are tools for evaluation—not trading instructions.
- TrendCharts content does not account for personal financial conditions, goals, or investment profile.
- Before making any financial decisions, consult with a licensed financial advisor or SEBI-registered professional.
- Do not rely solely on any information presented on our site for actual trades.
- Datafeeds and information may be delayed as per data vendor policies or exchange requirements.
- We do not guarantee the real-time accuracy, timeliness, or completeness of such data.
- No legal claim may be made against us or our data providers based on inaccuracies.
- Any user testimonials are individual opinions and may not represent the typical user experience.
- Hypothetical performance results involve inherent limitations and should not be relied upon for real-money decisions.
- All opinions, data, signals, and analyses shared on the website are subject to change without notice.
- TrendCharts reserves the right to modify tools, content, and services at its discretion.
- Our software or product names are for branding purposes only and do not imply any market prediction or financial guarantee.
- No claim is made regarding profitability from any software usage.
- All content—charts, indicators, tools, or data—is designed for testing, analysis, and learning.
- No real-money trading or investment recommendations are provided or supported.
 Final Note: Trading in financial markets is speculative and may not be suitable for all investors. TrendCharts.in provides various automatic signal setups for Paper Trading & help in Analysis, it is not a “black box” system to be used without careful evaluation. Users must apply their judgment in filtering automated setups, particularly in relation to broader market trends. All trading decisions are solely the responsibility of the individual trader. Trading and investing involve risks, and losses are inevitable, So Kindly use only risk capital and never invest money you cannot afford to lose.
 Always remember
 my 3R Rule
 : If the money
 is yours then, risk
 , reward
 and regret
 are solely yours.