Overview
-
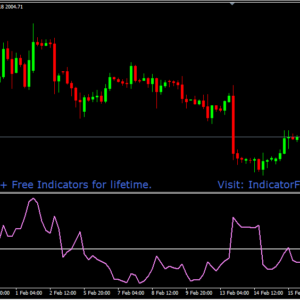
The Figurelli RSI MT4 Indicator is an advanced, smoother adaptation of the classic Relative Strength Index.
-
It filters out short-term noise, providing traders with more reliable momentum signals.
-
Designed to reduce false entries caused by market volatility.
-
Enables traders to identify genuine overbought and oversold zones with higher confidence.
Why Traders Prefer It Over Standard RSI
-
Standard RSI often reacts too quickly to minor price fluctuations.
-
The Figurelli RSI introduces a refined smoothing algorithm, minimizing whipsaws and false signals.
-
Offers stable and consistent readings, making it easier to trust each signal.
-
Especially beneficial for swing and day traders, as it tracks true momentum shifts instead of short-lived reactions.
-
Builds trading discipline by reducing overtrading caused by noisy RSI readings.
How It Improves Trading Strategies
-
Works seamlessly across multiple markets — forex, indices, metals, and commodities.
-
Can be combined with moving averages, trendlines, or candlestick confirmations for higher accuracy.
-
Helps traders time entries and exits more effectively by aligning RSI signals with trend direction.
-
Reduces emotional or impulsive decisions by showing clearer momentum trends.
-
Suitable for both manual and automated strategies, ensuring flexibility in different setups.
Trading Guidelines
✅ Buy Entry
-
Wait for the Figurelli RSI line to cross above 30, showing the end of oversold conditions.
-
Confirm upward momentum as the RSI continues toward 50 or higher.
-
Validate with bullish price action, such as a strong candle or a bounce from support.
-
Enter a Buy trade and place a stop-loss just below the recent swing low.
🔻 Sell Entry
-
Watch for the Figurelli RSI line to cross below 70, signaling the end of overbought conditions.
-
Confirm downward momentum as the RSI continues toward 50 or lower.
-
Validate with bearish confirmations, like rejection candles or resistance zone reactions.
-
Enter a Sell trade and set a stop-loss just above the recent swing high.
Conclusion
-
The Figurelli RSI MT4 Indicator enhances classic RSI performance by offering smoother and more accurate signals.
-
Helps traders avoid false momentum readings and trade only when strength aligns with market direction.
-
Perfect for traders seeking clarity, precision, and reduced noise in their technical setups.
-
Whether you’re a beginner or professional, this indicator adds confidence and structure to your decision-making process.
Risk Disclaimer
- TrendCharts.in and its associated products, services, software, and tools do not provide any offer or solicitation to buy or sell securities, futures, forex, commodities, or derivatives.
- We are not SEBI Registered Investment Advisors or Research Analysts.
- All materials are strictly for educational, informational, and paper trading & help in analysis purposes only.
- We do not provide advice for Real Money Trade, tips, buy/sell recommendations, or investment strategies.
- TrendCharts is solely involved in the development, sell, resale, and distribution of financial market software, datafeeds, indicators, scanners, and tools.
- All our offerings are intended for testing strategies and educational evaluation only—not for real-money trading.
- Users may utilize the software and tools for paper trading or strategy evaluation only.
- If users apply our offerings to actual trading (knowingly or unknowingly), TrendCharts.in or its stakeholders bear no responsibility for any profit or loss.
- Any such use is at the user’s sole discretion and risk.
- We explicitly disclaim liability for any financial loss, trading loss, or damages resulting from:
- Use of our software, tools, or services.
- Decisions made based on any charts, indicators, AFLs, data, or analysis from our products.
- All market data and content provided are subject to delays, inaccuracies, or errors.
- Past performance (actual or hypothetical) is not indicative of future results.
- Hypothetical or backtested performance may not reflect the impact of actual market conditions.
- Trading and investing involve substantial financial risk and can result in loss of capital beyond the initial investment.
- Users must use individual discretion and independent judgment while interpreting signals, strategies, or chart setups.
- Automated signals or scanners are tools for evaluation—not trading instructions.
- TrendCharts content does not account for personal financial conditions, goals, or investment profile.
- Before making any financial decisions, consult with a licensed financial advisor or SEBI-registered professional.
- Do not rely solely on any information presented on our site for actual trades.
- Datafeeds and information may be delayed as per data vendor policies or exchange requirements.
- We do not guarantee the real-time accuracy, timeliness, or completeness of such data.
- No legal claim may be made against us or our data providers based on inaccuracies.
- Any user testimonials are individual opinions and may not represent the typical user experience.
- Hypothetical performance results involve inherent limitations and should not be relied upon for real-money decisions.
- All opinions, data, signals, and analyses shared on the website are subject to change without notice.
- TrendCharts reserves the right to modify tools, content, and services at its discretion.
- Our software or product names are for branding purposes only and do not imply any market prediction or financial guarantee.
- No claim is made regarding profitability from any software usage.
- All content—charts, indicators, tools, or data—is designed for testing, analysis, and learning.
- No real-money trading or investment recommendations are provided or supported.
 Final Note: Trading in financial markets is speculative and may not be suitable for all investors. TrendCharts.in provides various automatic signal setups for Paper Trading & help in Analysis, it is not a “black box” system to be used without careful evaluation. Users must apply their judgment in filtering automated setups, particularly in relation to broader market trends. All trading decisions are solely the responsibility of the individual trader. Trading and investing involve risks, and losses are inevitable, So Kindly use only risk capital and never invest money you cannot afford to lose.
 Always remember
 my 3R Rule
 : If the money
 is yours then, risk
 , reward
 and regret
 are solely yours.