✅ Overview
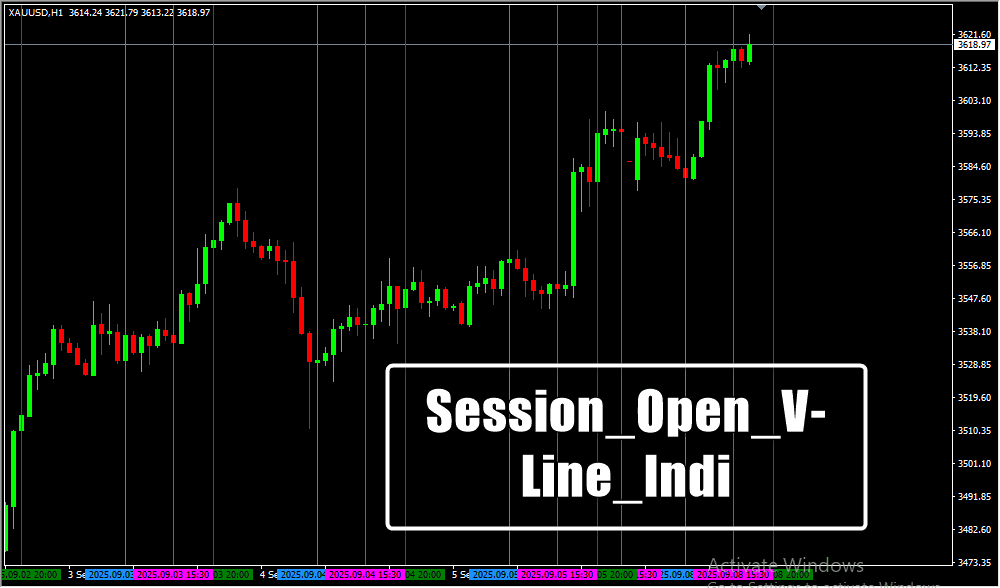
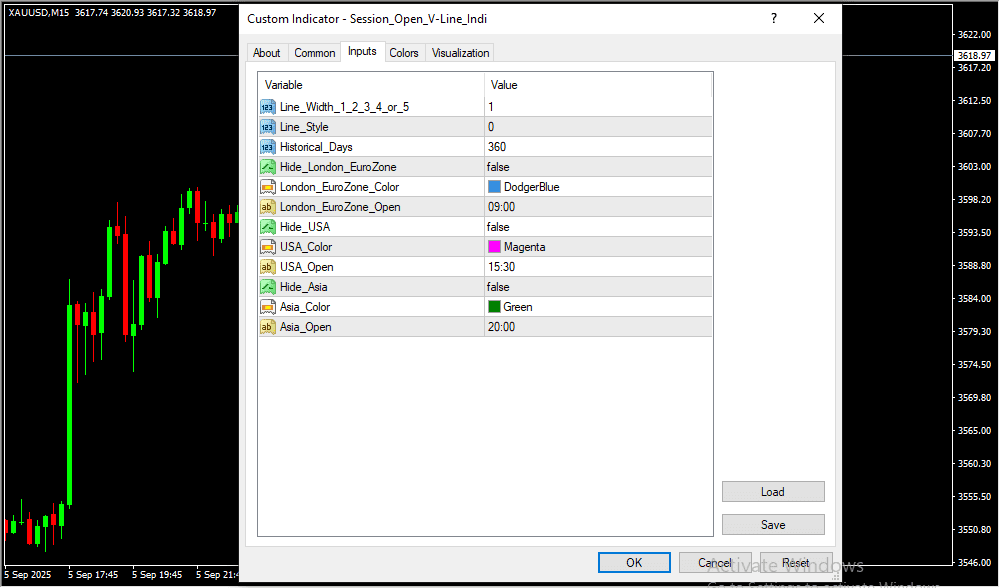
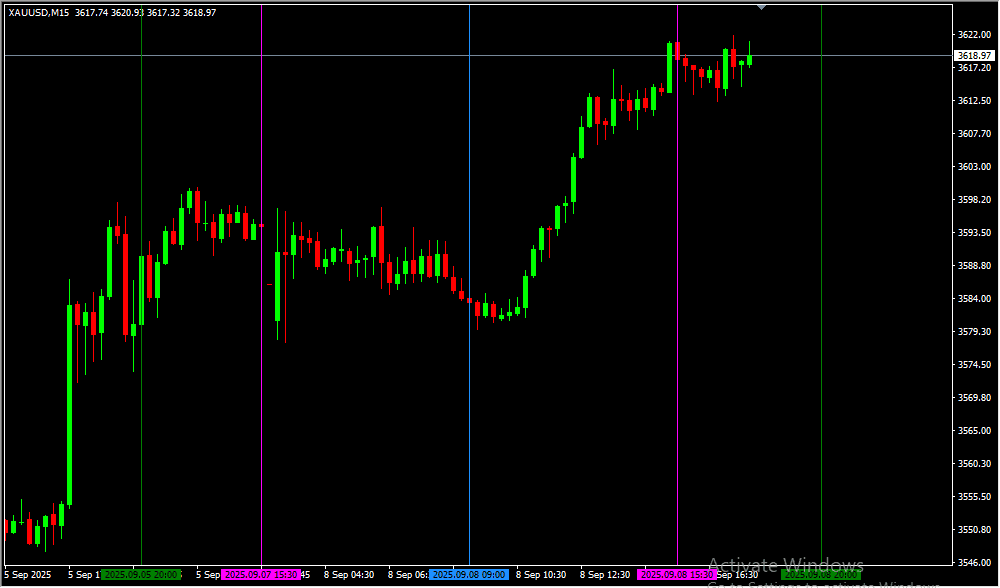
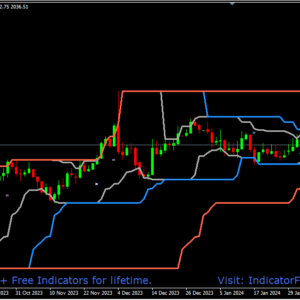
The Session Open V-Line Indi MT4 Indicator automatically plots vertical lines to mark the start of major trading sessions — such as London, New York, and Tokyo.
These lines give traders instant awareness of when institutional activity and market momentum typically increase.
By clearly showing when new sessions begin, the indicator helps traders plan entries, manage risk, and anticipate volatility with confidence.
✅ Why This Indicator Matters
-
The opening of each major session often brings a surge in liquidity and volatility.
-
Without clear session markers, traders may miss crucial breakout opportunities or enter too early.
-
The indicator automatically draws session-start lines, saving time and removing guesswork.
-
It ensures that traders are always prepared for market shifts when volume and movement peak.
-
Especially valuable for those who prefer to trade only during active hours.
✅ How Traders Can Benefit
-
Day Traders: Identify when strong trends or breakouts are likely to start.
-
Scalpers: Use session lines to catch quick moves in high-volume conditions.
-
Swing Traders: Avoid false signals during low-volatility hours.
-
Allows traders to plan their schedule around active sessions, maximizing focus and efficiency.
-
Helps recognize when to avoid overtrading during quiet market periods.
✅ How to Trade with Session Open V-Line Indi MT4 Indicator
🔸 Buy Entry
-
Wait for a new session vertical line (London or New York preferred).
-
Confirm bullish strength by checking if price trends above a recent support level.
-
Look for bullish candlestick formations near the session open (e.g., bullish engulfing).
-
Enter a buy trade once confirmation appears within the first few candles.
-
Set stop-loss below the recent swing low.
-
Target next resistance or use a 1:2 risk-reward ratio.
🔸 Sell Entry
-
Wait for the session line to appear marking a new trading period.
-
Confirm bearish sentiment below a recent resistance zone.
-
Watch for bearish candle patterns near the session open (e.g., strong rejection or engulfing).
-
Enter a sell trade after confirmation during the early volatility wave.
-
Set stop-loss above recent swing high.
-
Take profit at next support or maintain a 1:2 risk-reward.
✅ Benefits
-
Keeps traders aware of when real market action begins.
-
Simplifies session-based trading strategies.
-
Reduces emotional and premature entries.
-
Works across Forex, indices, and commodities.
-
Compatible with other indicators like RSI, MACD, and Moving Averages for confirmation.
✅ Conclusion
The Session Open V-Line Indi MT4 Indicator is a simple yet powerful timing tool that highlights the most important trading moments of the day.
By automatically marking when major sessions begin, it helps traders stay aligned with market activity and trade with precision.
Whether you’re a beginner or a professional, this indicator enhances timing, confidence, and strategy execution across all trading styles.
Risk Disclaimer
- TrendCharts.in and its associated products, services, software, and tools do not provide any offer or solicitation to buy or sell securities, futures, forex, commodities, or derivatives.
- We are not SEBI Registered Investment Advisors or Research Analysts.
- All materials are strictly for educational, informational, and paper trading & help in analysis purposes only.
- We do not provide advice for Real Money Trade, tips, buy/sell recommendations, or investment strategies.
- TrendCharts is solely involved in the development, sell, resale, and distribution of financial market software, datafeeds, indicators, scanners, and tools.
- All our offerings are intended for testing strategies and educational evaluation only—not for real-money trading.
- Users may utilize the software and tools for paper trading or strategy evaluation only.
- If users apply our offerings to actual trading (knowingly or unknowingly), TrendCharts.in or its stakeholders bear no responsibility for any profit or loss.
- Any such use is at the user’s sole discretion and risk.
- We explicitly disclaim liability for any financial loss, trading loss, or damages resulting from:
- Use of our software, tools, or services.
- Decisions made based on any charts, indicators, AFLs, data, or analysis from our products.
- All market data and content provided are subject to delays, inaccuracies, or errors.
- Past performance (actual or hypothetical) is not indicative of future results.
- Hypothetical or backtested performance may not reflect the impact of actual market conditions.
- Trading and investing involve substantial financial risk and can result in loss of capital beyond the initial investment.
- Users must use individual discretion and independent judgment while interpreting signals, strategies, or chart setups.
- Automated signals or scanners are tools for evaluation—not trading instructions.
- TrendCharts content does not account for personal financial conditions, goals, or investment profile.
- Before making any financial decisions, consult with a licensed financial advisor or SEBI-registered professional.
- Do not rely solely on any information presented on our site for actual trades.
- Datafeeds and information may be delayed as per data vendor policies or exchange requirements.
- We do not guarantee the real-time accuracy, timeliness, or completeness of such data.
- No legal claim may be made against us or our data providers based on inaccuracies.
- Any user testimonials are individual opinions and may not represent the typical user experience.
- Hypothetical performance results involve inherent limitations and should not be relied upon for real-money decisions.
- All opinions, data, signals, and analyses shared on the website are subject to change without notice.
- TrendCharts reserves the right to modify tools, content, and services at its discretion.
- Our software or product names are for branding purposes only and do not imply any market prediction or financial guarantee.
- No claim is made regarding profitability from any software usage.
- All content—charts, indicators, tools, or data—is designed for testing, analysis, and learning.
- No real-money trading or investment recommendations are provided or supported.
 Final Note: Trading in financial markets is speculative and may not be suitable for all investors. TrendCharts.in provides various automatic signal setups for Paper Trading & help in Analysis, it is not a “black box” system to be used without careful evaluation. Users must apply their judgment in filtering automated setups, particularly in relation to broader market trends. All trading decisions are solely the responsibility of the individual trader. Trading and investing involve risks, and losses are inevitable, So Kindly use only risk capital and never invest money you cannot afford to lose.
 Always remember
 my 3R Rule
 : If the money
 is yours then, risk
 , reward
 and regret
 are solely yours.