✅ Overview
-
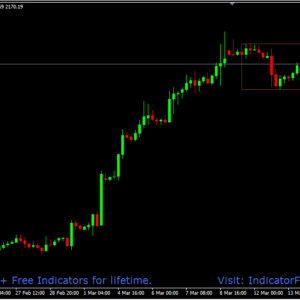
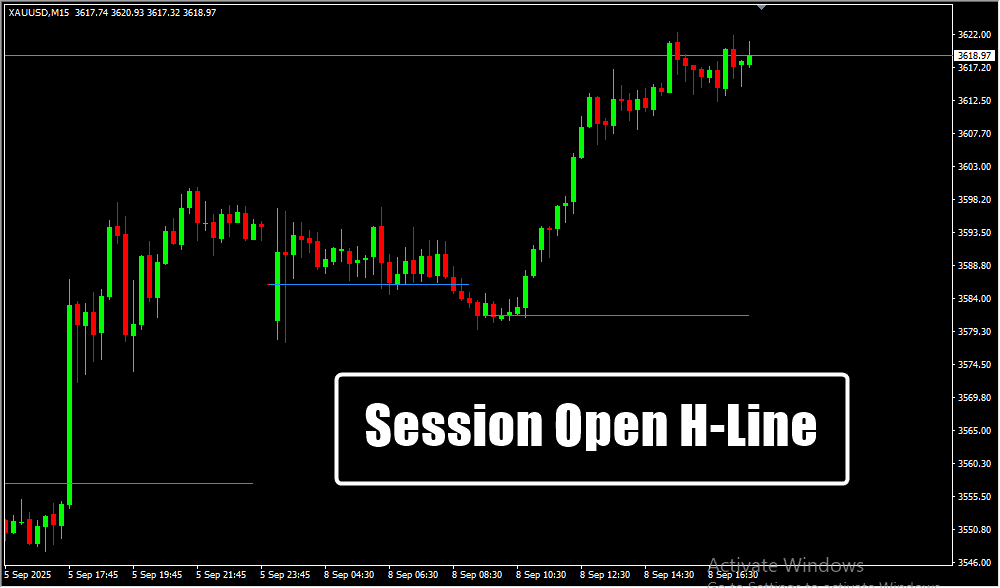
The Session Open H-Line MT4 Indicator automatically draws a horizontal line at the session’s opening price.
-
Acts as a critical reference point to gauge whether price action is bullish (above) or bearish (below).
-
Ideal for intraday traders, offering a clear structure for analyzing early market direction.
-
Helps identify session-based support and resistance zones for better entry and exit decisions.
✅ Why This Indicator Matters
-
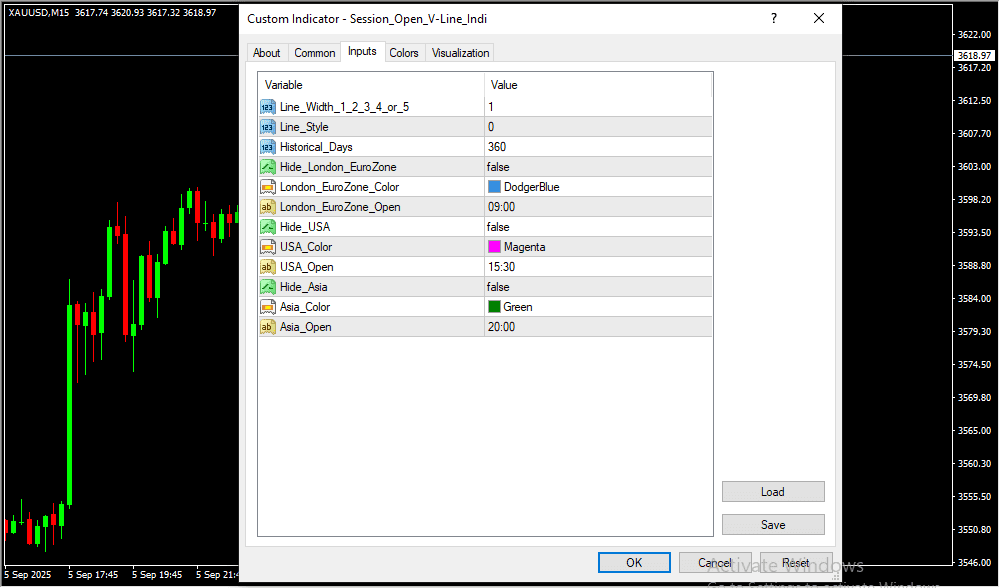
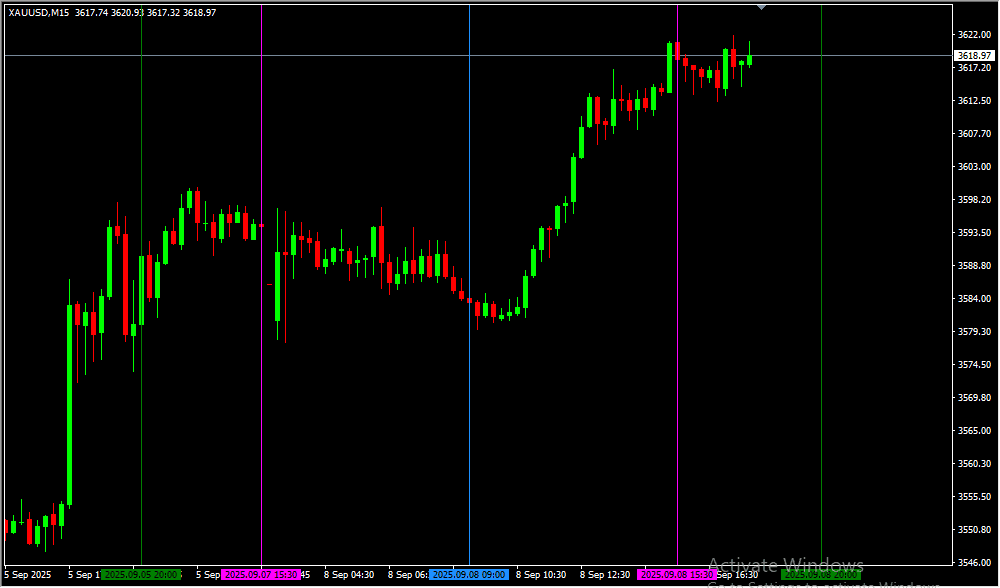
Different sessions (London, New York, Tokyo) introduce unique volatility patterns.
-
Traders often make mistakes entering too early without session context — this indicator fixes that.
-
When price stays above the H-Line, it shows bullish momentum; when below, bearish control.
-
Improves accuracy by filtering out false breakouts and confirming true session bias.
-
Encourages discipline and patience in early session trading.
✅ Practical Uses in Trading
-
Scalpers: Time quick entries around session open for short bursts of profit.
-
Day traders: Use it to monitor whether price sustains above or below the session level.
-
Swing traders: Compare multiple sessions to confirm medium-term trend direction.
-
Can be combined with moving averages, RSI, or MACD for stronger trade confirmation.
-
Integrates smoothly with price-action setups (breakouts, retests, engulfing candles).
✅ How to Trade with Session Open H-Line
🔸 Buy Entry
-
Wait for a new session to begin and observe the plotted H-Line.
-
Enter a buy trade when price holds above the line with bullish candles.
-
Confirm with RSI, MACD, or a moving average crossover.
-
Stop-loss: Below the H-Line or nearest support.
-
Take-profit: At next resistance or a 1:2 risk-reward level.
🔸 Sell Entry
-
Wait for session open and identify the H-Line.
-
Enter a sell trade when price remains below the line with bearish candles.
-
Confirm with bearish engulfing patterns or momentum indicators.
-
Stop-loss: Above the H-Line or nearest resistance.
-
Take-profit: At next support or maintain a 1:2 risk-reward.
✅ Benefits
-
Provides instant directional bias from session start.
-
Simplifies session-based price structure analysis.
-
Improves trade accuracy and risk control.
-
Reduces confusion during high-volatility openings.
-
Works for Forex, indices, and commodities.
✅ Conclusion
-
The Session Open H-Line MT4 Indicator offers clarity and precision at the start of every trading session.
-
By marking the session’s open, it helps traders quickly understand market sentiment and price dynamics.
-
A simple yet high-impact tool that transforms early session uncertainty into profitable trading opportunities.
 Final Note: Trading in financial markets is speculative and may not be suitable for all investors. TrendCharts.in provides various automatic signal setups for Paper Trading & help in Analysis, it is not a “black box” system to be used without careful evaluation. Users must apply their judgment in filtering automated setups, particularly in relation to broader market trends. All trading decisions are solely the responsibility of the individual trader. Trading and investing involve risks, and losses are inevitable, So Kindly use only risk capital and never invest money you cannot afford to lose.
 Always remember
 my 3R Rule
 : If the money
 is yours then, risk
 , reward
 and regret
 are solely yours.