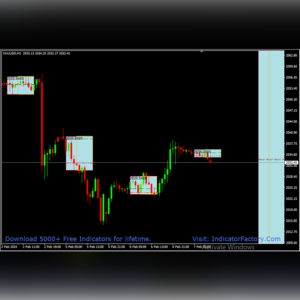
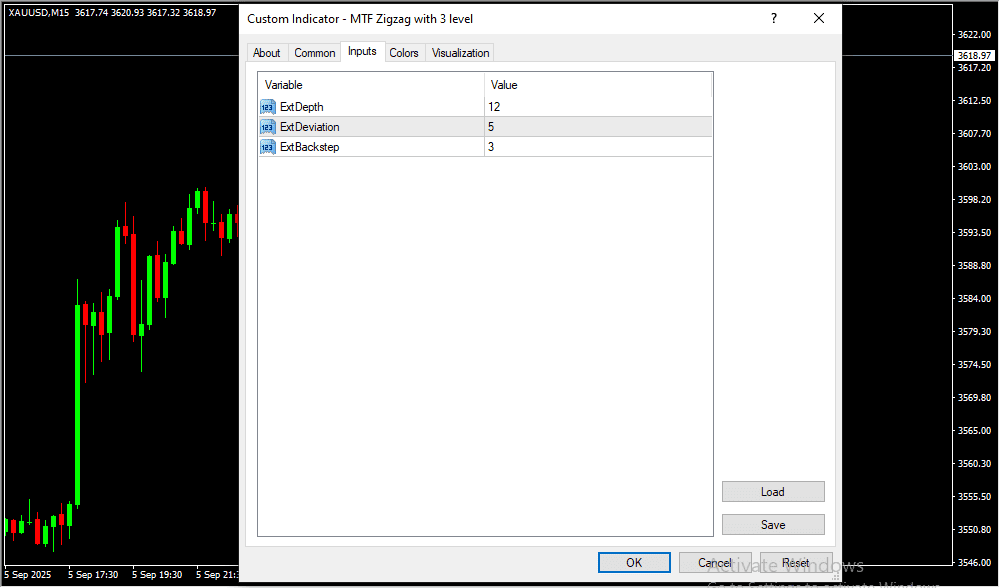
✅ Overview
-
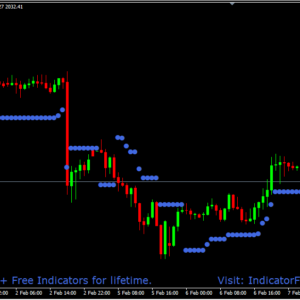
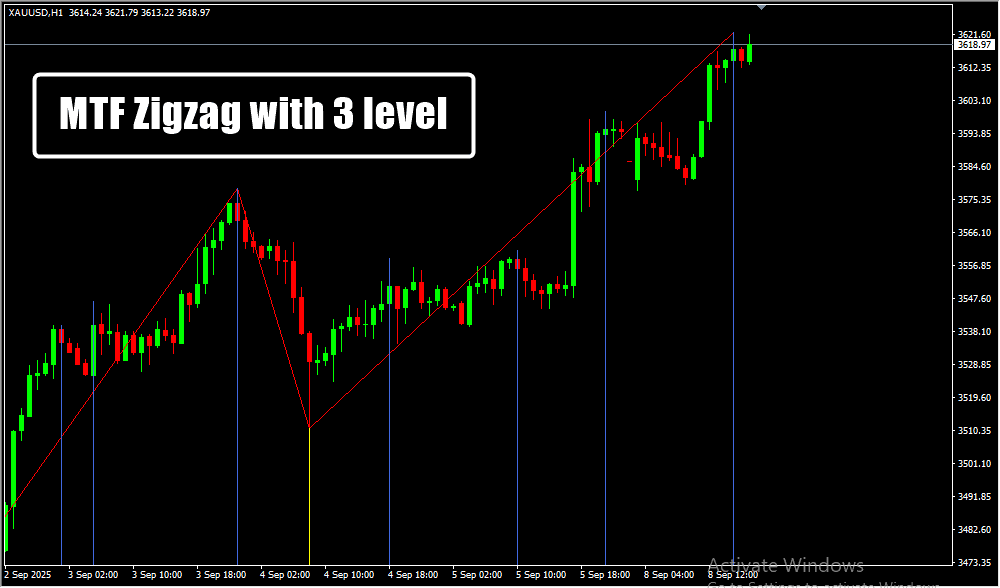
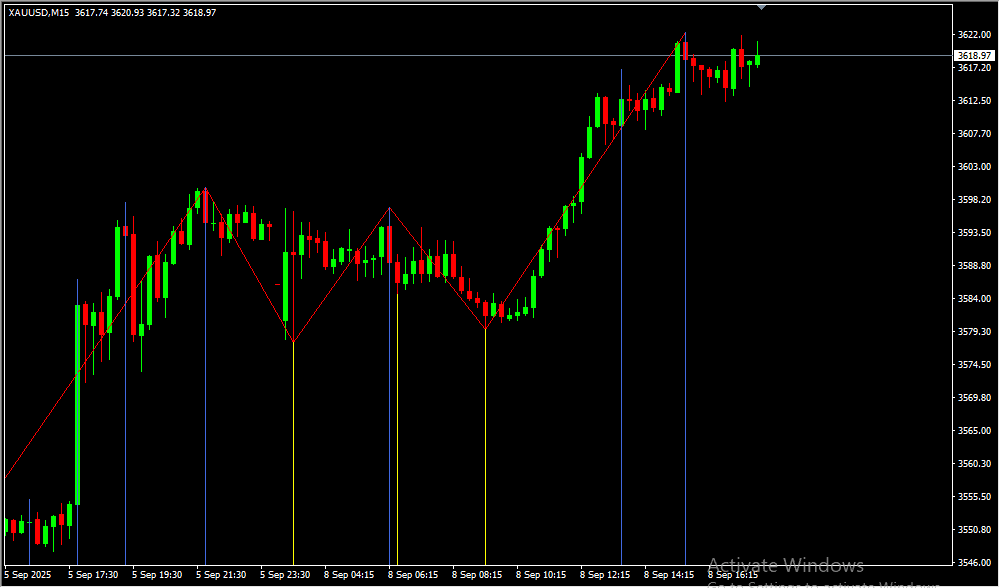
The MTF Zigzag with 3 Level MT4 Indicator displays market swings across three timeframes—minor, medium, and major—simultaneously.
-
Helps traders see how smaller and larger price movements interact to form the overall market trend.
-
Offers a layered perspective, making it easier to recognize trend direction, pullbacks, and potential reversals.
✅ Why It Stands Out for Traders
-
Goes beyond the standard zigzag tool by adding a multi-timeframe (MTF) view.
-
Perfect for swing and position traders who rely on broader market structure.
-
Confirms whether a move is a minor correction or part of a major trend shift.
-
Reduces false signals and enhances trade confidence.
-
Creates a clear roadmap for entries, exits, and stop-loss levels.
✅ How Traders Can Use It Effectively
-
Adaptable to different trading styles:
-
Scalpers focus on the minor level for quick trades.
-
Swing traders follow medium and major levels for longer trends.
-
-
Trend Continuation: When smaller zigzag levels align with larger ones.
-
Trend Reversal: When smaller levels move opposite to the main trend, signaling early warning.
-
Helps traders spot multi-level confluence zones where price is more likely to react.
✅ How to Trade with MTF Zigzag with 3 Level Indicator
-
Buy Entry:
-
Wait for a minor swing low aligning with the medium/major upward trend.
-
Confirm higher lows across at least two zigzag levels.
-
Enter on bullish bounce from swing low.
-
Stop-loss: Below the last zigzag low.
-
Take-profit: Near the next medium or major zigzag high.
-
-
Sell Entry:
-
Wait for a minor swing high aligning with the medium/major downtrend.
-
Confirm lower highs across at least two zigzag levels.
-
Enter on bearish rejection from swing high.
-
Stop-loss: Above the last zigzag high.
-
Take-profit: Near the next medium or major zigzag low.
-
✅ Benefits
-
Gives a multi-timeframe confirmation in one chart.
-
Improves accuracy in identifying real trend shifts.
-
Filters out market noise for clearer price structure.
-
Suitable for all assets and timeframes (Forex, commodities, indices, crypto).
-
Supports both manual and strategy-based trading.
✅ Conclusion
-
The MTF Zigzag with 3 Level MT4 Indicator provides a complete market overview by combining three levels of price movement.
-
It transforms complex market swings into clear, visual patterns for smarter trade planning.
-
A must-have tool for traders seeking multi-timeframe clarity, precise entries, and confident decision-making.
 Final Note: Trading in financial markets is speculative and may not be suitable for all investors. TrendCharts.in provides various automatic signal setups for Paper Trading & help in Analysis, it is not a “black box” system to be used without careful evaluation. Users must apply their judgment in filtering automated setups, particularly in relation to broader market trends. All trading decisions are solely the responsibility of the individual trader. Trading and investing involve risks, and losses are inevitable, So Kindly use only risk capital and never invest money you cannot afford to lose.
 Always remember
 my 3R Rule
 : If the money
 is yours then, risk
 , reward
 and regret
 are solely yours.