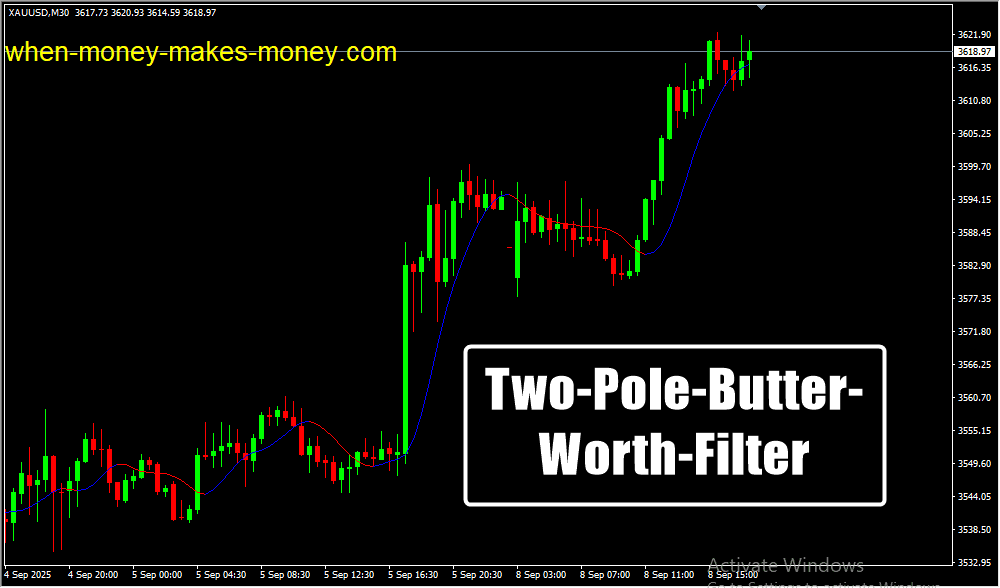
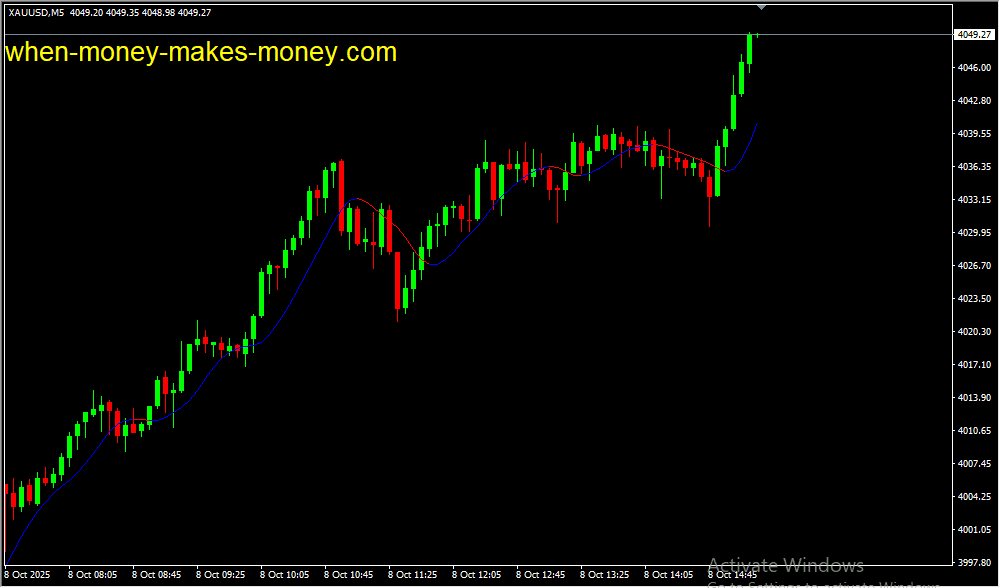
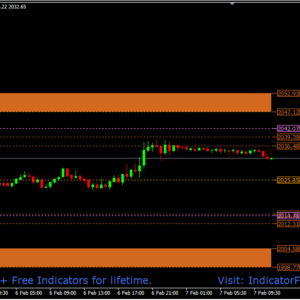
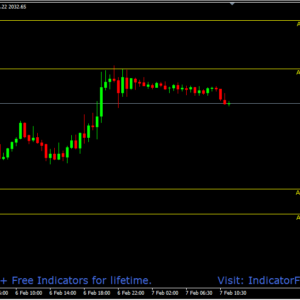
The Two Pole Butter Worth Filter MT4 Indicator is a precision smoothing tool built to remove market noise while keeping essential price details intact. Unlike standard moving averages that tend to lag, this indicator uses an advanced Butterworth filter algorithm, offering a cleaner and more responsive trend view. It’s ideal for traders who want a smooth yet accurate reflection of price direction — perfect for short-, medium-, or long-term trading strategies.
⚙️ How Traders Use It
Traders use this indicator to cut through random market fluctuations and focus on true price direction. It delivers a smooth trend curve that minimizes false signals and clarifies overall market movement. Whether you’re a day trader looking for quick shifts or a swing trader analyzing broader trends, the Two Pole Butter Worth Filter helps refine decision-making and boost confidence in trade entries and exits.
💡 Benefits of the Two Pole Butter Worth Filter
The biggest advantage of this indicator is its ability to balance smoothness with responsiveness.
Too much smoothing delays signals — too little leaves noise. This filter achieves an optimal midpoint, allowing traders to identify real trends without reacting to minor fluctuations.
Key benefits include:
-
Reduced chart noise for clearer analysis.
-
Faster trend recognition than standard MAs.
-
Reliable signals across all timeframes.
-
Better emotional control by reducing overreactions to sudden price spikes.
🧭 How to Make the Most of It
The indicator works well as a standalone trend filter or in combination with tools like RSI, MACD, or support/resistance zones.
Traders often use it to:
-
Confirm market direction before entering trades.
-
Filter out weak or choppy setups.
-
Align trades with the broader market momentum.
This approach improves accuracy, consistency, and overall trading discipline.
💰 How to Trade with Two Pole Butter Worth Filter MT4 Indicator
Buy Entry
-
Wait for price to move above the Two Pole Butter Worth Filter line.
-
Confirm the filter is sloping upward, indicating bullish strength.
-
Look for a bullish candle close above the filter to validate the signal.
-
(Optional) Confirm with RSI above 50 or a MACD bullish crossover.
-
Place stop-loss below the recent swing low and target the next resistance zone.
Sell Entry
-
Wait for price to move below the Two Pole Butter Worth Filter line.
-
Confirm the line is sloping downward, showing bearish pressure.
-
Look for a bearish candle close below the filter for confirmation.
-
(Optional) Validate with RSI below 50 or a MACD bearish crossover.
-
Place stop-loss above the recent swing high and aim for the next support level.
🏁 Conclusion
The Two Pole Butter Worth Filter MT4 Indicator offers a sophisticated yet simple way to smooth market data and highlight genuine trends. It helps traders reduce chart noise, stay calm under volatility, and make objective, strategy-driven decisions. Whether used for intraday trades or long-term trend analysis, this indicator is a must-have addition to any MT4 toolkit — enhancing clarity, timing, and trading consistency.
Risk Disclaimer
- TrendCharts.in and its associated products, services, software, and tools do not provide any offer or solicitation to buy or sell securities, futures, forex, commodities, or derivatives.
- We are not SEBI Registered Investment Advisors or Research Analysts.
- All materials are strictly for educational, informational, and paper trading & help in analysis purposes only.
- We do not provide advice for Real Money Trade, tips, buy/sell recommendations, or investment strategies.
- TrendCharts is solely involved in the development, sell, resale, and distribution of financial market software, datafeeds, indicators, scanners, and tools.
- All our offerings are intended for testing strategies and educational evaluation only—not for real-money trading.
- Users may utilize the software and tools for paper trading or strategy evaluation only.
- If users apply our offerings to actual trading (knowingly or unknowingly), TrendCharts.in or its stakeholders bear no responsibility for any profit or loss.
- Any such use is at the user’s sole discretion and risk.
- We explicitly disclaim liability for any financial loss, trading loss, or damages resulting from:
- Use of our software, tools, or services.
- Decisions made based on any charts, indicators, AFLs, data, or analysis from our products.
- All market data and content provided are subject to delays, inaccuracies, or errors.
- Past performance (actual or hypothetical) is not indicative of future results.
- Hypothetical or backtested performance may not reflect the impact of actual market conditions.
- Trading and investing involve substantial financial risk and can result in loss of capital beyond the initial investment.
- Users must use individual discretion and independent judgment while interpreting signals, strategies, or chart setups.
- Automated signals or scanners are tools for evaluation—not trading instructions.
- TrendCharts content does not account for personal financial conditions, goals, or investment profile.
- Before making any financial decisions, consult with a licensed financial advisor or SEBI-registered professional.
- Do not rely solely on any information presented on our site for actual trades.
- Datafeeds and information may be delayed as per data vendor policies or exchange requirements.
- We do not guarantee the real-time accuracy, timeliness, or completeness of such data.
- No legal claim may be made against us or our data providers based on inaccuracies.
- Any user testimonials are individual opinions and may not represent the typical user experience.
- Hypothetical performance results involve inherent limitations and should not be relied upon for real-money decisions.
- All opinions, data, signals, and analyses shared on the website are subject to change without notice.
- TrendCharts reserves the right to modify tools, content, and services at its discretion.
- Our software or product names are for branding purposes only and do not imply any market prediction or financial guarantee.
- No claim is made regarding profitability from any software usage.
- All content—charts, indicators, tools, or data—is designed for testing, analysis, and learning.
- No real-money trading or investment recommendations are provided or supported.
 Final Note: Trading in financial markets is speculative and may not be suitable for all investors. TrendCharts.in provides various automatic signal setups for Paper Trading & help in Analysis, it is not a “black box” system to be used without careful evaluation. Users must apply their judgment in filtering automated setups, particularly in relation to broader market trends. All trading decisions are solely the responsibility of the individual trader. Trading and investing involve risks, and losses are inevitable, So Kindly use only risk capital and never invest money you cannot afford to lose.
 Always remember
 my 3R Rule
 : If the money
 is yours then, risk
 , reward
 and regret
 are solely yours.