Overview
-
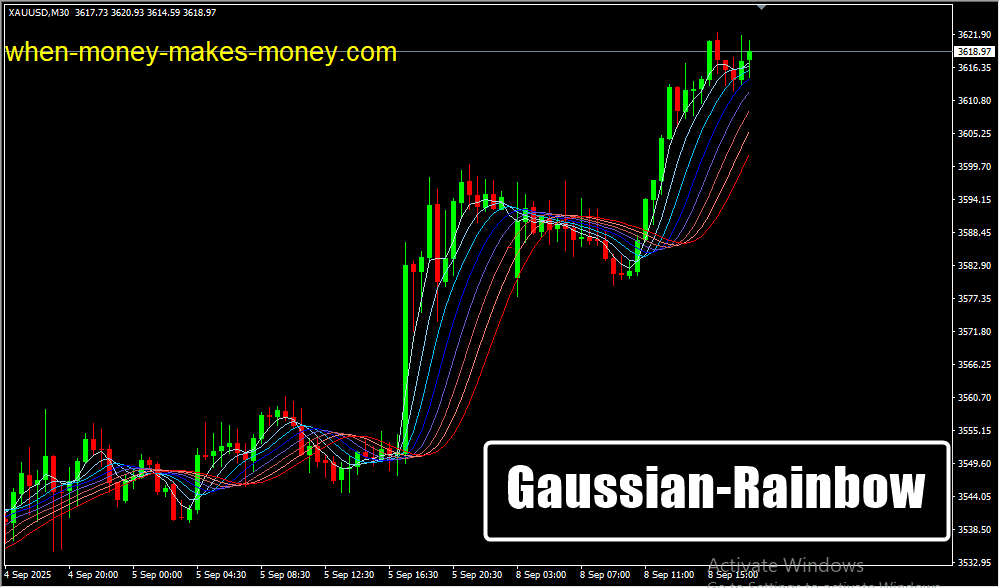
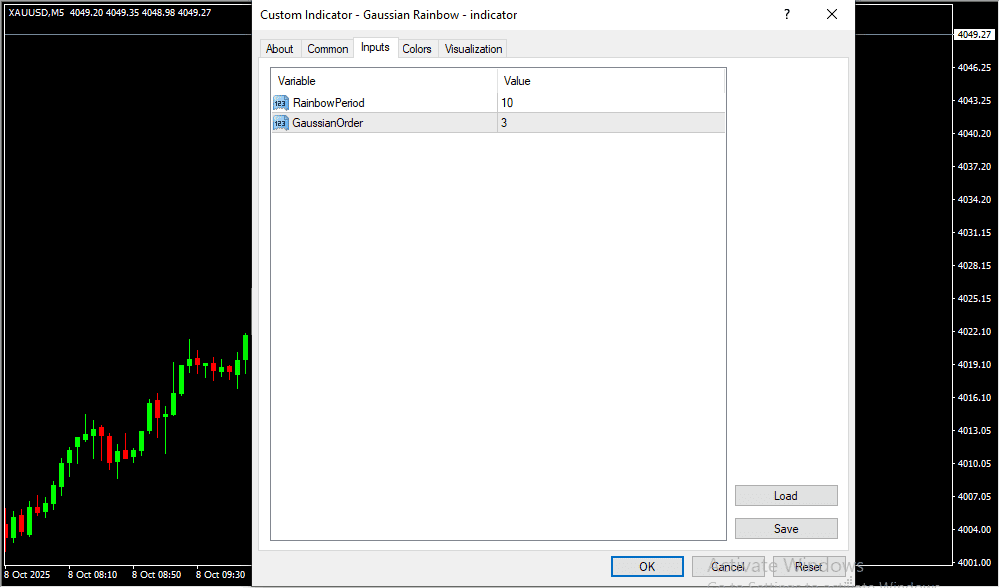
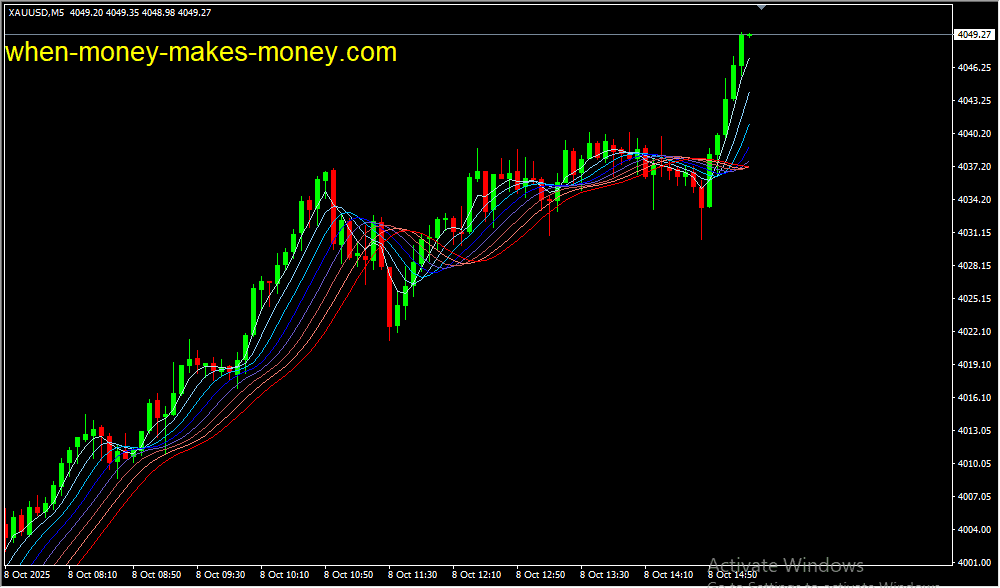
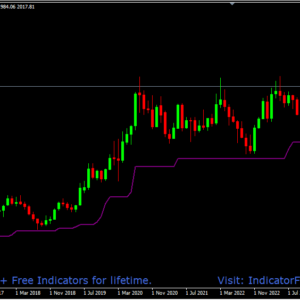
The Gaussian Rainbow MT4 Indicator is a trend-following system that applies Gaussian smoothing to multiple moving averages.
-
Instead of showing just one average, it displays a layered “rainbow effect” that represents trend strength and market direction.
-
This multi-line setup helps traders filter out noise and focus on true market momentum.
-
With its smooth and visually clear structure, the indicator makes it easy to spot trend reversals and continuation patterns at a glance.
Why Traders Use It
-
Traditional moving averages often produce false signals during choppy or sideways markets.
-
The Gaussian Rainbow reduces these whipsaws by smoothing out price fluctuations.
-
Traders gain a clearer and steadier view of trend development, improving timing for entries and exits.
-
Works well as both a standalone system and a confirmation tool with other indicators like RSI or MACD.
-
Especially valuable for traders who want less noise and more accuracy in fast-moving conditions.
How It Helps in Real Trading
-
Ideal for all trading styles: scalping, intraday, swing, and position trading.
-
On lower timeframes, it highlights short-term opportunities; on higher timeframes, it captures major trend directions.
-
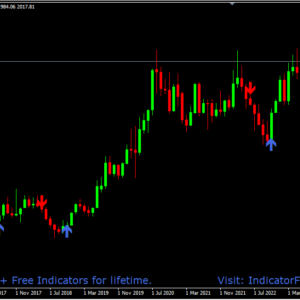
When rainbow lines are aligned in one direction, it confirms a strong ongoing trend.
-
When lines twist, flatten, or intersect, it signals market consolidation or reversal potential.
-
This makes it a flexible and adaptive tool for multiple market conditions.
Trading Guidelines
✅ Buy Entry
-
Wait for rainbow lines to align upward in a smooth ascending pattern.
-
Confirm that price is above most rainbow lines.
-
Enter a Buy trade when the rainbow spreads upward, showing strong bullish momentum.
-
Set a stop-loss below the recent swing low or below the rainbow cluster.
-
Exit when the lines begin to flatten or curve downward.
🔻 Sell Entry
-
Wait for rainbow lines to align downward in a descending pattern.
-
Confirm that price is below most rainbow lines.
-
Enter a Sell trade when the rainbow spreads downward, indicating strong bearish pressure.
-
Place a stop-loss above the recent swing high or rainbow cluster.
-
Exit when lines begin to flatten or curve upward.
Conclusion
-
The Gaussian Rainbow MT4 Indicator provides a smooth, visually clear, and reliable trend framework.
-
It minimizes market noise and helps traders stay aligned with the dominant direction.
-
Whether you’re a beginner seeking simplicity or a professional wanting cleaner analysis, this tool makes trend trading more structured and confident.
-
By highlighting momentum strength and reversals, it helps traders make smarter, stress-free trading decisions.
Risk Disclaimer
- TrendCharts.in and its associated products, services, software, and tools do not provide any offer or solicitation to buy or sell securities, futures, forex, commodities, or derivatives.
- We are not SEBI Registered Investment Advisors or Research Analysts.
- All materials are strictly for educational, informational, and paper trading & help in analysis purposes only.
- We do not provide advice for Real Money Trade, tips, buy/sell recommendations, or investment strategies.
- TrendCharts is solely involved in the development, sell, resale, and distribution of financial market software, datafeeds, indicators, scanners, and tools.
- All our offerings are intended for testing strategies and educational evaluation only—not for real-money trading.
- Users may utilize the software and tools for paper trading or strategy evaluation only.
- If users apply our offerings to actual trading (knowingly or unknowingly), TrendCharts.in or its stakeholders bear no responsibility for any profit or loss.
- Any such use is at the user’s sole discretion and risk.
- We explicitly disclaim liability for any financial loss, trading loss, or damages resulting from:
- Use of our software, tools, or services.
- Decisions made based on any charts, indicators, AFLs, data, or analysis from our products.
- All market data and content provided are subject to delays, inaccuracies, or errors.
- Past performance (actual or hypothetical) is not indicative of future results.
- Hypothetical or backtested performance may not reflect the impact of actual market conditions.
- Trading and investing involve substantial financial risk and can result in loss of capital beyond the initial investment.
- Users must use individual discretion and independent judgment while interpreting signals, strategies, or chart setups.
- Automated signals or scanners are tools for evaluation—not trading instructions.
- TrendCharts content does not account for personal financial conditions, goals, or investment profile.
- Before making any financial decisions, consult with a licensed financial advisor or SEBI-registered professional.
- Do not rely solely on any information presented on our site for actual trades.
- Datafeeds and information may be delayed as per data vendor policies or exchange requirements.
- We do not guarantee the real-time accuracy, timeliness, or completeness of such data.
- No legal claim may be made against us or our data providers based on inaccuracies.
- Any user testimonials are individual opinions and may not represent the typical user experience.
- Hypothetical performance results involve inherent limitations and should not be relied upon for real-money decisions.
- All opinions, data, signals, and analyses shared on the website are subject to change without notice.
- TrendCharts reserves the right to modify tools, content, and services at its discretion.
- Our software or product names are for branding purposes only and do not imply any market prediction or financial guarantee.
- No claim is made regarding profitability from any software usage.
- All content—charts, indicators, tools, or data—is designed for testing, analysis, and learning.
- No real-money trading or investment recommendations are provided or supported.
 Final Note: Trading in financial markets is speculative and may not be suitable for all investors. TrendCharts.in provides various automatic signal setups for Paper Trading & help in Analysis, it is not a “black box” system to be used without careful evaluation. Users must apply their judgment in filtering automated setups, particularly in relation to broader market trends. All trading decisions are solely the responsibility of the individual trader. Trading and investing involve risks, and losses are inevitable, So Kindly use only risk capital and never invest money you cannot afford to lose.
 Always remember
 my 3R Rule
 : If the money
 is yours then, risk
 , reward
 and regret
 are solely yours.