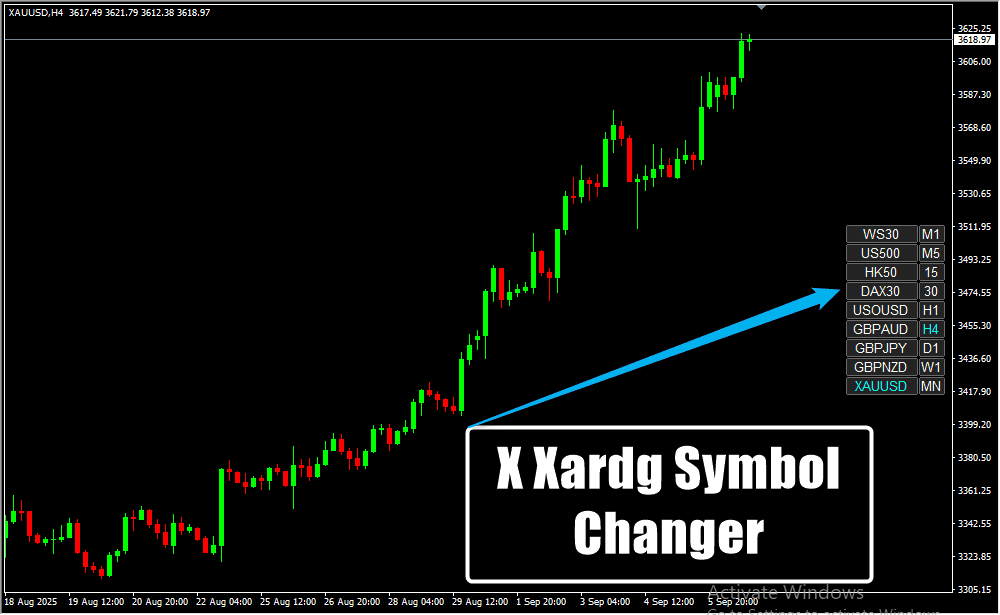
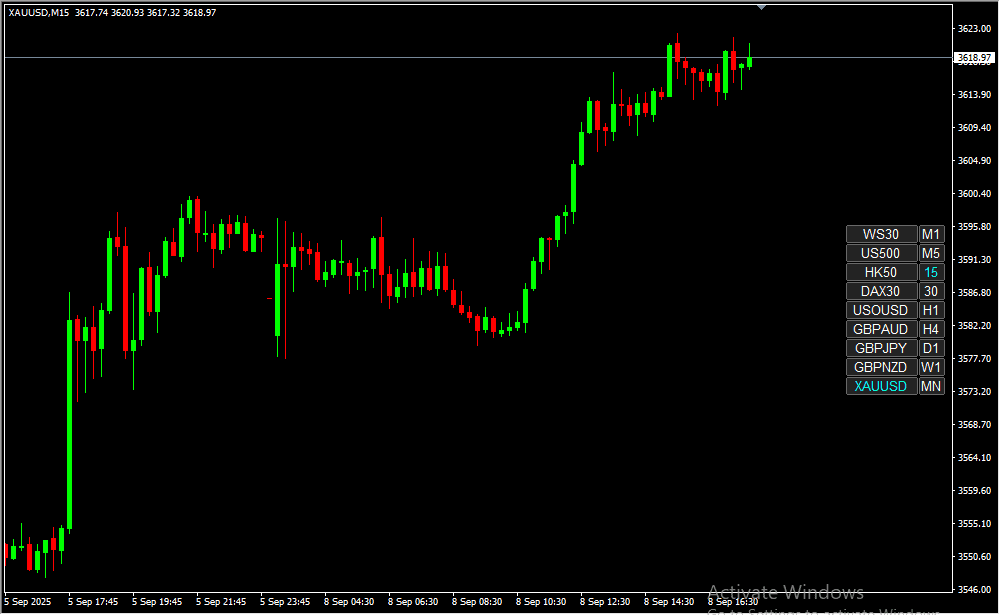
📊 Multi-Instrument Display – Shows multiple financial instruments in a dedicated panel for quick access.
🔄 Seamless Symbol Switching – Effortlessly switch between different currency pairs or instruments with one click.
⚡ Multi-Timeframe Support – Change timeframes for any instrument instantly within the same panel.
🎯 Ideal for All Traders – Perfect for scalpers, day traders, and swing traders who monitor multiple markets.
🖥️ Reduces Chart Clutter – Keeps your workspace clean by integrating multiple instruments into a single button panel.
🎨 Customizable Interface – Add or remove instruments based on your trading style and frequency.
🚀 Faster Trading Decisions – Save time switching charts and focus more on technical analysis.
🛠️ User-Friendly Design – Easy to install, simple to use, and highly effective for multi-pair monitoring.
🆓 Free MT4 Indicator – Available at no cost for traders of all levels.
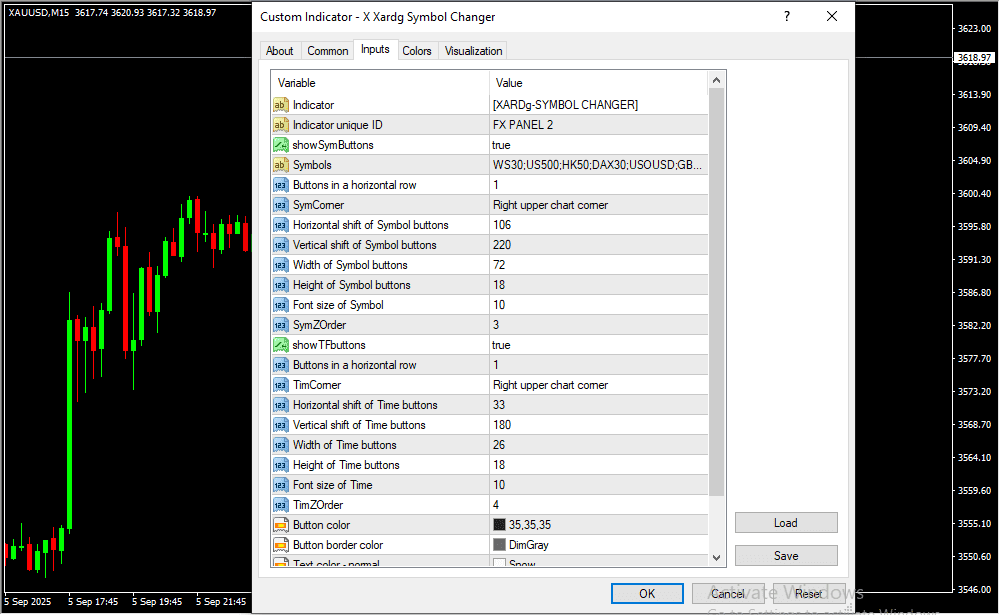
Input Settings & Controls
-
Indicator → Name or type of indicator being used.
-
Indicator unique ID → Unique identifier assigned to the indicator instance.
-
showSymButtons → Option to display or hide symbol-selection buttons.
-
Symbols → List of available trading symbols to display on buttons.
-
Buttons in a horizontal row → Arranges the symbol buttons in a single horizontal line.
-
SymComer → Defines the corner of the chart where symbol buttons are placed.
-
Horizontal shift of Symbol buttons → Adjusts horizontal spacing/offset of symbol buttons.
-
Vertical shift of Symbol buttons → Adjusts vertical spacing/offset of symbol buttons.
-
Width of Symbol buttons → Width dimension of symbol buttons.
-
Height of Symbol buttons → Height dimension of symbol buttons.
-
Font size of Symbol → Font size used for symbol button labels.
-
SymZOrder → Layer order (priority) of symbol buttons on the chart.
-
show TFbuttons → Option to display or hide timeframe-selection buttons.
-
Buttons in a horizontal row → Arranges the timeframe buttons in a single horizontal line.
-
TimComer → Defines the corner of the chart where timeframe buttons are placed.
-
Horizontal shift of Time buttons → Adjusts horizontal spacing/offset of timeframe buttons.
-
Vertical shift of Time buttons → Adjusts vertical spacing/offset of timeframe buttons.
-
Width of Time buttons → Width dimension of timeframe buttons.
-
Height of Time buttons → Height dimension of timeframe buttons.
-
Font size of Time → Font size used for timeframe button labels.
-
TimZOrder → Layer order (priority) of timeframe buttons on the chart.
-
Button color → Fill/background color of the buttons.
-
Button border color → Outline/border color of the buttons.
Devices Supported
| Device Type | Operating System | Compatibility with TradingView |
|---|---|---|
| 💻 Windows Laptop/Desktop | Windows XP / Vista / 7 / 8 / 8.1 / 10 / 11 | ✅ Fully supported via app |
| 🍏 MacBook / iMac | macOS 10.15+ | ✅ Fully supported via app |
| 📱 Android / Mobile | Android OS | ❌ Not supported |
Risk Disclaimer
- TrendCharts.in and its associated products, services, software, and tools do not provide any offer or solicitation to buy or sell securities, futures, forex, commodities, or derivatives.
- We are not SEBI Registered Investment Advisors or Research Analysts.
- All materials are strictly for educational, informational, and paper trading & help in analysis purposes only.
- We do not provide advice for Real Money Trade, tips, buy/sell recommendations, or investment strategies.
- TrendCharts is solely involved in the development, sell, resale, and distribution of financial market software, datafeeds, indicators, scanners, and tools.
- All our offerings are intended for testing strategies and educational evaluation only—not for real-money trading.
- Users may utilize the software and tools for paper trading or strategy evaluation only.
- If users apply our offerings to actual trading (knowingly or unknowingly), TrendCharts.in or its stakeholders bear no responsibility for any profit or loss.
- Any such use is at the user’s sole discretion and risk.
- We explicitly disclaim liability for any financial loss, trading loss, or damages resulting from:
- Use of our software, tools, or services.
- Decisions made based on any charts, indicators, AFLs, data, or analysis from our products.
- All market data and content provided are subject to delays, inaccuracies, or errors.
- Past performance (actual or hypothetical) is not indicative of future results.
- Hypothetical or backtested performance may not reflect the impact of actual market conditions.
- Trading and investing involve substantial financial risk and can result in loss of capital beyond the initial investment.
- Users must use individual discretion and independent judgment while interpreting signals, strategies, or chart setups.
- Automated signals or scanners are tools for evaluation—not trading instructions.
- TrendCharts content does not account for personal financial conditions, goals, or investment profile.
- Before making any financial decisions, consult with a licensed financial advisor or SEBI-registered professional.
- Do not rely solely on any information presented on our site for actual trades.
- Datafeeds and information may be delayed as per data vendor policies or exchange requirements.
- We do not guarantee the real-time accuracy, timeliness, or completeness of such data.
- No legal claim may be made against us or our data providers based on inaccuracies.
- Any user testimonials are individual opinions and may not represent the typical user experience.
- Hypothetical performance results involve inherent limitations and should not be relied upon for real-money decisions.
- All opinions, data, signals, and analyses shared on the website are subject to change without notice.
- TrendCharts reserves the right to modify tools, content, and services at its discretion.
- Our software or product names are for branding purposes only and do not imply any market prediction or financial guarantee.
- No claim is made regarding profitability from any software usage.
- All content—charts, indicators, tools, or data—is designed for testing, analysis, and learning.
- No real-money trading or investment recommendations are provided or supported.
 Final Note: Trading in financial markets is speculative and may not be suitable for all investors. TrendCharts.in provides various automatic signal setups for Paper Trading & help in Analysis, it is not a “black box” system to be used without careful evaluation. Users must apply their judgment in filtering automated setups, particularly in relation to broader market trends. All trading decisions are solely the responsibility of the individual trader. Trading and investing involve risks, and losses are inevitable, So Kindly use only risk capital and never invest money you cannot afford to lose.
 Always remember
 my 3R Rule
 : If the money
 is yours then, risk
 , reward
 and regret
 are solely yours.