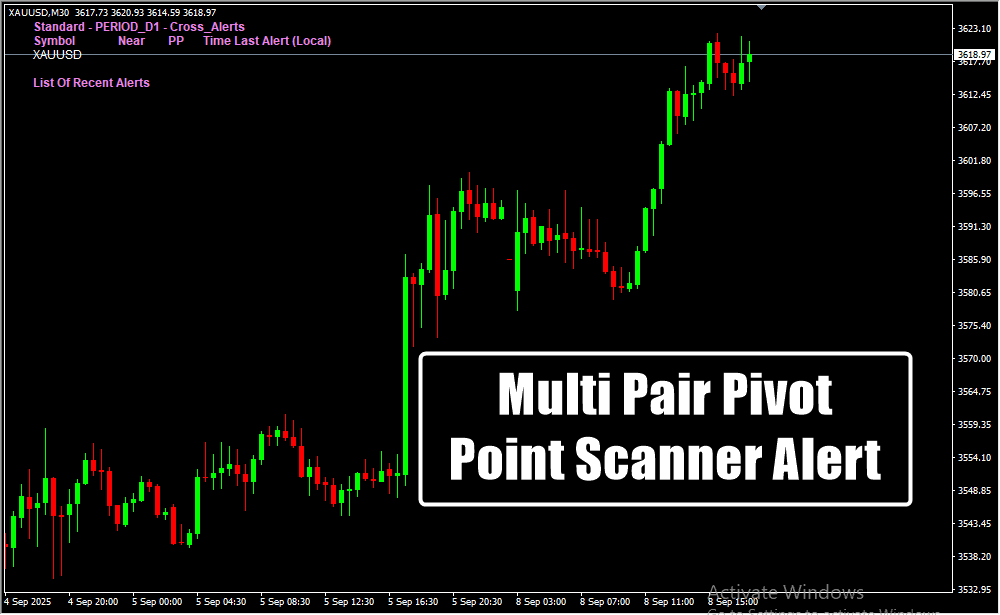
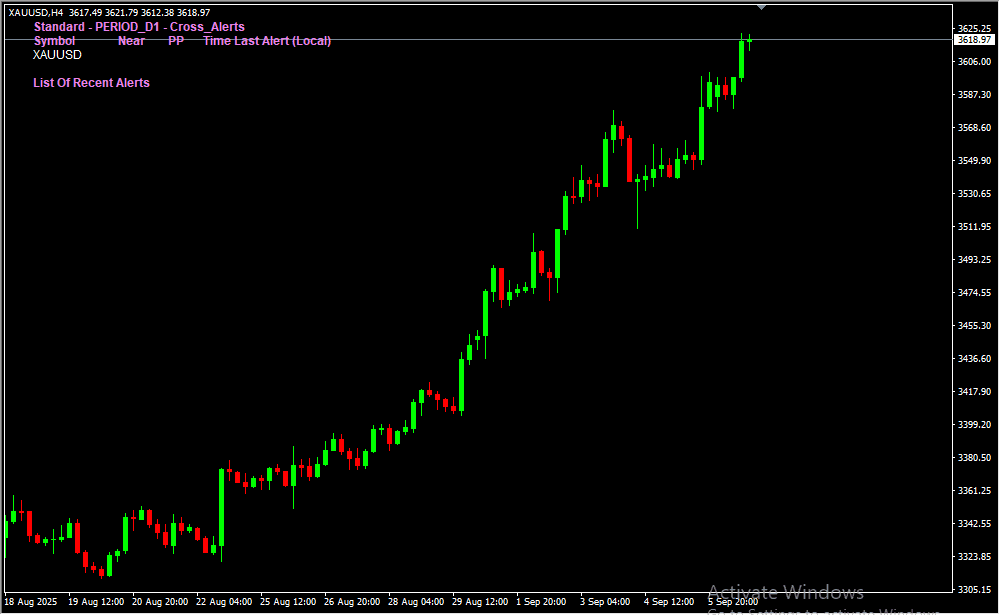
⚡ Multi-Pair Scanning – Monitors multiple currency pairs simultaneously for pivot points.
📈 Pivot Point Detection – Identifies key support and resistance levels for trading decisions.
🔔 Alerts & Notifications – Notifies traders when price reaches pivot points.
🎯 Entry & Exit Guidance – Supports trading strategies by highlighting potential opportunities.
⏱️ Multi-Timeframe Compatible – Suitable for short-term and long-term trading strategies.
💡 Customizable Settings – Adjust the pairs, sensitivity, and alert preferences to suit your style.
💹 Enhanced Market Awareness – Helps traders stay informed and make timely decisions.
🛠️ Easy Installation – Download and apply on MT4 quickly and effortlessly.
🌟 For Beginners & Experts – Simple enough for novices, powerful for experienced traders.
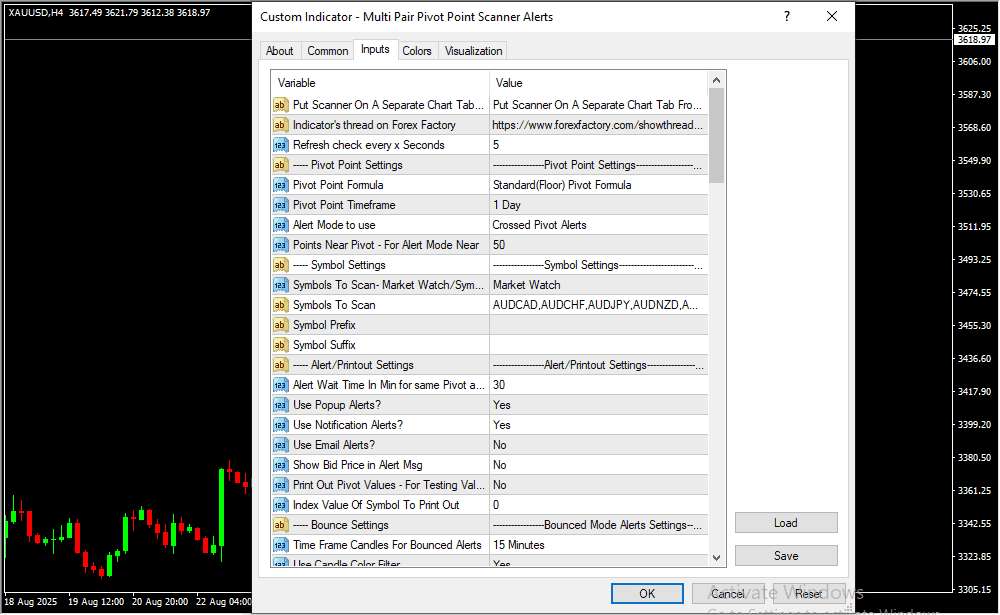
Input Settings & Controls
| Variable | Description |
|---|---|
| Put Scanner On A Separate Chart Tab … | Runs the scanner in its own chart tab instead of on the main chart. |
| Indicator’s Thread On Forex Factory | Reference link/info for the indicator’s discussion thread on Forex Factory. |
| Refresh check every x Seconds | Interval (in seconds) for refreshing the scanner. |
| Pivot Point Formula | Formula used to calculate pivot points (e.g., Classic, Fibonacci, Camarilla, Woodie’s). |
| Pivot Point Timeframe | Timeframe from which pivot points are calculated (e.g., Daily, Weekly). |
| Alert Mode to use | Defines the type of alert to generate (e.g., when price touches pivot, near pivot, or breaks pivot). |
| Points Near Pivot – For Alert Mode Near | Number of points from pivot level that will trigger a “near pivot” alert. |
| Symbols To Scan – Market Watch / Symbol List | Source of symbols for scanning (Market Watch or custom list). |
| Symbols To Scan | The specific list of symbols/pairs to be scanned. |
| Symbol Prefix | Prefix used for broker-specific symbol names (e.g., mEURUSD). |
| Symbol Suffix | Suffix used for broker-specific symbol names (e.g., EURUSDm). |
| Alert Wait Time In Min for same Pivot alert | Minimum wait time (in minutes) before repeating the same pivot alert. |
| Use Popup Alerts? | Enables or disables popup alerts. |
| Use Notification Alerts? | Enables push/mobile notifications. |
| Use Email Alerts? | Enables email alerts when conditions are met. |
| Show Bid Price in Alert Msg | If enabled, the bid price is included in the alert message. |
| Print Out Pivot Values – For Testing Values | Debug option to print pivot values in the terminal log for testing. |
| Index Value Of Symbol To Print Out | Chooses which symbol’s pivot values to print (by index in the symbol list). |
| Time Frame Candles For Bounced Alerts | Defines the timeframe to check candle closes for bounce alerts (e.g., H1 candle bouncing from pivot). |
Devices Supported
| Device Type | Operating System | Compatibility with TradingView |
|---|---|---|
| 💻 Windows Laptop/Desktop | Windows XP / Vista / 7 / 8 / 8.1 / 10 / 11 | ✅ Fully supported via app |
| 🍏 MacBook / iMac | macOS 10.15+ | ✅ Fully supported via app |
| 📱 Android / Mobile | Android OS | ❌ Not supported |
Risk Disclaimer
- TrendCharts.in and its associated products, services, software, and tools do not provide any offer or solicitation to buy or sell securities, futures, forex, commodities, or derivatives.
- We are not SEBI Registered Investment Advisors or Research Analysts.
- All materials are strictly for educational, informational, and paper trading & help in analysis purposes only.
- We do not provide advice for Real Money Trade, tips, buy/sell recommendations, or investment strategies.
- TrendCharts is solely involved in the development, sell, resale, and distribution of financial market software, datafeeds, indicators, scanners, and tools.
- All our offerings are intended for testing strategies and educational evaluation only—not for real-money trading.
- Users may utilize the software and tools for paper trading or strategy evaluation only.
- If users apply our offerings to actual trading (knowingly or unknowingly), TrendCharts.in or its stakeholders bear no responsibility for any profit or loss.
- Any such use is at the user’s sole discretion and risk.
- We explicitly disclaim liability for any financial loss, trading loss, or damages resulting from:
- Use of our software, tools, or services.
- Decisions made based on any charts, indicators, AFLs, data, or analysis from our products.
- All market data and content provided are subject to delays, inaccuracies, or errors.
- Past performance (actual or hypothetical) is not indicative of future results.
- Hypothetical or backtested performance may not reflect the impact of actual market conditions.
- Trading and investing involve substantial financial risk and can result in loss of capital beyond the initial investment.
- Users must use individual discretion and independent judgment while interpreting signals, strategies, or chart setups.
- Automated signals or scanners are tools for evaluation—not trading instructions.
- TrendCharts content does not account for personal financial conditions, goals, or investment profile.
- Before making any financial decisions, consult with a licensed financial advisor or SEBI-registered professional.
- Do not rely solely on any information presented on our site for actual trades.
- Datafeeds and information may be delayed as per data vendor policies or exchange requirements.
- We do not guarantee the real-time accuracy, timeliness, or completeness of such data.
- No legal claim may be made against us or our data providers based on inaccuracies.
- Any user testimonials are individual opinions and may not represent the typical user experience.
- Hypothetical performance results involve inherent limitations and should not be relied upon for real-money decisions.
- All opinions, data, signals, and analyses shared on the website are subject to change without notice.
- TrendCharts reserves the right to modify tools, content, and services at its discretion.
- Our software or product names are for branding purposes only and do not imply any market prediction or financial guarantee.
- No claim is made regarding profitability from any software usage.
- All content—charts, indicators, tools, or data—is designed for testing, analysis, and learning.
- No real-money trading or investment recommendations are provided or supported.
 Final Note: Trading in financial markets is speculative and may not be suitable for all investors. TrendCharts.in provides various automatic signal setups for Paper Trading & help in Analysis, it is not a “black box” system to be used without careful evaluation. Users must apply their judgment in filtering automated setups, particularly in relation to broader market trends. All trading decisions are solely the responsibility of the individual trader. Trading and investing involve risks, and losses are inevitable, So Kindly use only risk capital and never invest money you cannot afford to lose.
 Always remember
 my 3R Rule
 : If the money
 is yours then, risk
 , reward
 and regret
 are solely yours.