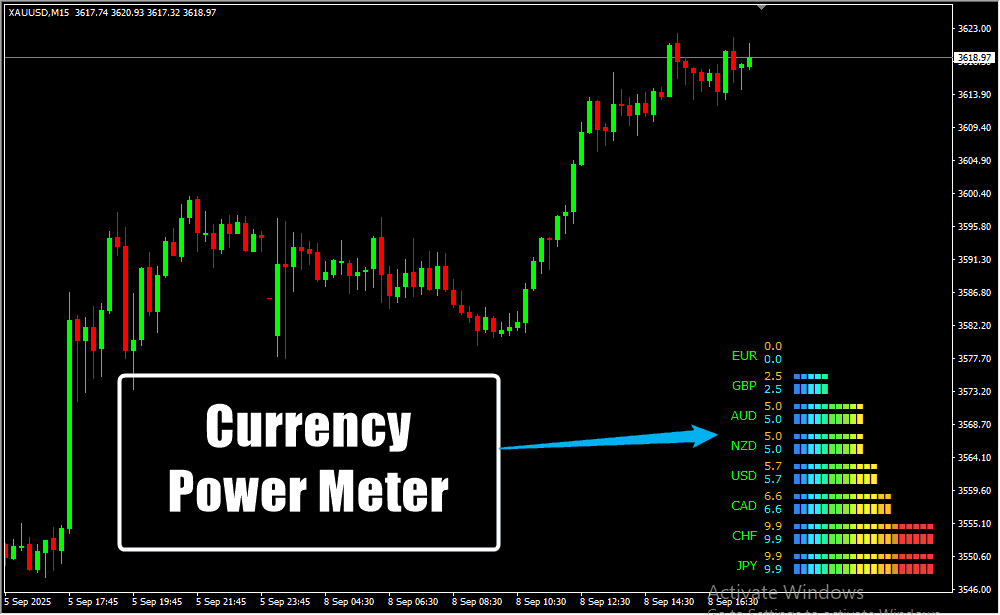
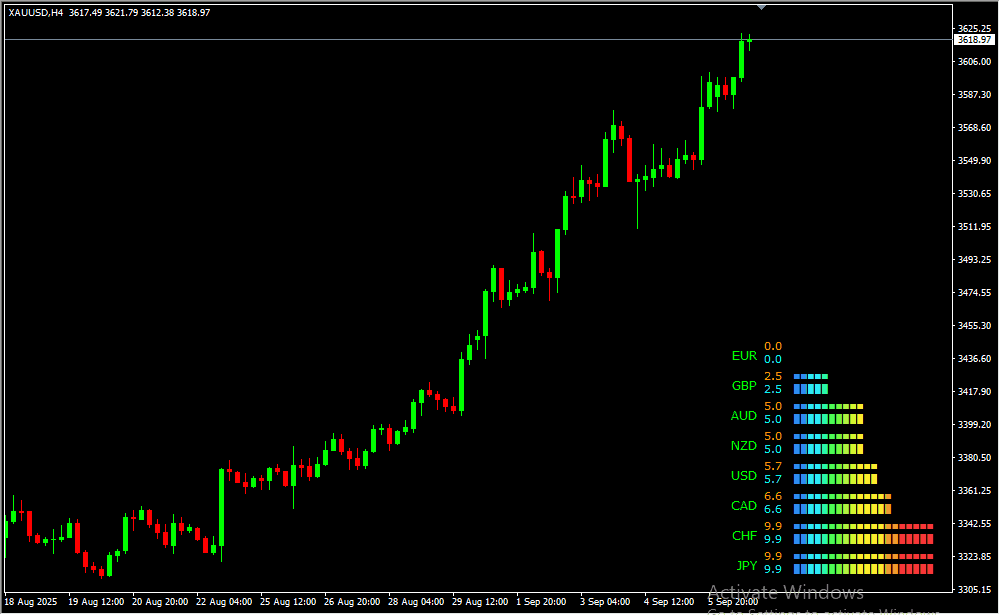
The Currency Power Meter Indicator for MT4 is a powerful tool for Forex traders aiming to simplify market analysis. Unlike traditional indicators that focus on currency pairs, this tool measures the strength of individual currencies. By identifying the strongest and weakest currencies, traders can make more informed decisions and apply the core trading principle: buy strong, sell weak.
Features of Currency Power Meter MT4 Indicator:
-
🔹 Dual Histogram Display: Shows two sets of histogram bars – wide bars represent daily currency power, while narrow bars display currency power for the chart’s timeframe.
-
🔹 Real-Time Updates: Reflects continuous price fluctuations, providing accurate and timely insight into currency strength.
-
🔹 Multi-Timeframe Support: Works on all major timeframes from M15 to W1, making it suitable for day trading, swing trading, and long-term strategies.
-
🔹 Easy-to-Understand Visuals: The histogram provides a clear view of relative currency power, allowing traders to quickly assess bullish or bearish conditions.
-
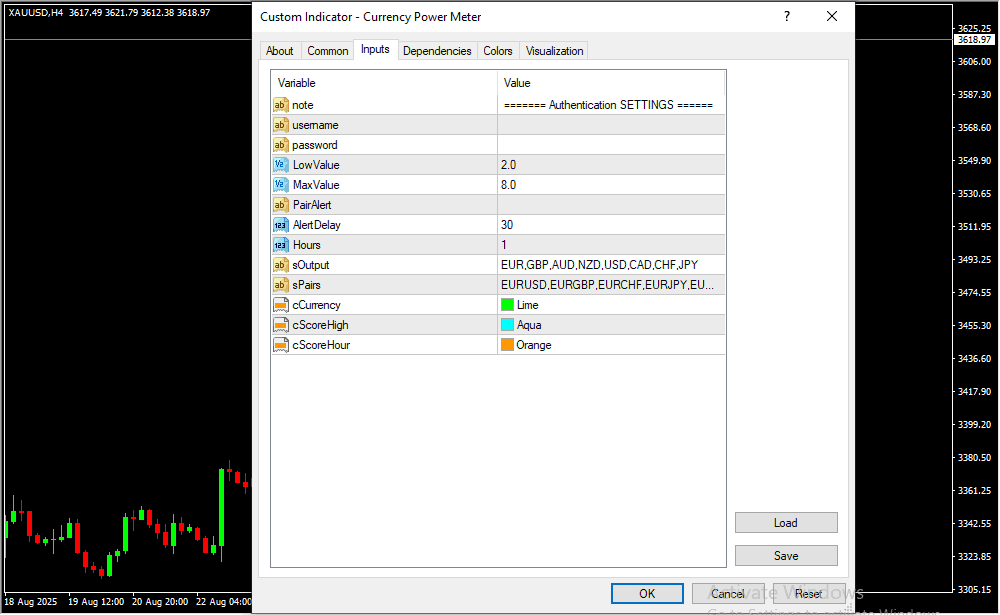
🔹 Customizable Settings: Adjust the chart timeframe and input parameters to fit your trading style.
Benefits for Traders:
-
✅ Identify Best Currency Pairs: Quickly spot which currency pairs to trade based on strength vs. weakness.
-
✅ Enhanced Trade Decision-Making: Apply the “buy the strongest, sell the weakest” strategy with confidence.
-
✅ Understand Market Dynamics: Gauge bullish or bearish trends for each currency individually.
-
✅ Simplifies Analysis: Saves time by providing a clear visual representation of currency strength across multiple timeframes.
The Currency Power Meter MT4 is an essential indicator for traders seeking to improve their Forex trading performance by understanding the real-time power of currencies.
Risk Disclaimer
- TrendCharts.in and its associated products, services, software, and tools do not provide any offer or solicitation to buy or sell securities, futures, forex, commodities, or derivatives.
- We are not SEBI Registered Investment Advisors or Research Analysts.
- All materials are strictly for educational, informational, and paper trading & help in analysis purposes only.
- We do not provide advice for Real Money Trade, tips, buy/sell recommendations, or investment strategies.
- TrendCharts is solely involved in the development, sell, resale, and distribution of financial market software, datafeeds, indicators, scanners, and tools.
- All our offerings are intended for testing strategies and educational evaluation only—not for real-money trading.
- Users may utilize the software and tools for paper trading or strategy evaluation only.
- If users apply our offerings to actual trading (knowingly or unknowingly), TrendCharts.in or its stakeholders bear no responsibility for any profit or loss.
- Any such use is at the user’s sole discretion and risk.
- We explicitly disclaim liability for any financial loss, trading loss, or damages resulting from:
- Use of our software, tools, or services.
- Decisions made based on any charts, indicators, AFLs, data, or analysis from our products.
- All market data and content provided are subject to delays, inaccuracies, or errors.
- Past performance (actual or hypothetical) is not indicative of future results.
- Hypothetical or backtested performance may not reflect the impact of actual market conditions.
- Trading and investing involve substantial financial risk and can result in loss of capital beyond the initial investment.
- Users must use individual discretion and independent judgment while interpreting signals, strategies, or chart setups.
- Automated signals or scanners are tools for evaluation—not trading instructions.
- TrendCharts content does not account for personal financial conditions, goals, or investment profile.
- Before making any financial decisions, consult with a licensed financial advisor or SEBI-registered professional.
- Do not rely solely on any information presented on our site for actual trades.
- Datafeeds and information may be delayed as per data vendor policies or exchange requirements.
- We do not guarantee the real-time accuracy, timeliness, or completeness of such data.
- No legal claim may be made against us or our data providers based on inaccuracies.
- Any user testimonials are individual opinions and may not represent the typical user experience.
- Hypothetical performance results involve inherent limitations and should not be relied upon for real-money decisions.
- All opinions, data, signals, and analyses shared on the website are subject to change without notice.
- TrendCharts reserves the right to modify tools, content, and services at its discretion.
- Our software or product names are for branding purposes only and do not imply any market prediction or financial guarantee.
- No claim is made regarding profitability from any software usage.
- All content—charts, indicators, tools, or data—is designed for testing, analysis, and learning.
- No real-money trading or investment recommendations are provided or supported.
 Final Note: Trading in financial markets is speculative and may not be suitable for all investors. TrendCharts.in provides various automatic signal setups for Paper Trading & help in Analysis, it is not a “black box” system to be used without careful evaluation. Users must apply their judgment in filtering automated setups, particularly in relation to broader market trends. All trading decisions are solely the responsibility of the individual trader. Trading and investing involve risks, and losses are inevitable, So Kindly use only risk capital and never invest money you cannot afford to lose.
 Always remember
 my 3R Rule
 : If the money
 is yours then, risk
 , reward
 and regret
 are solely yours.