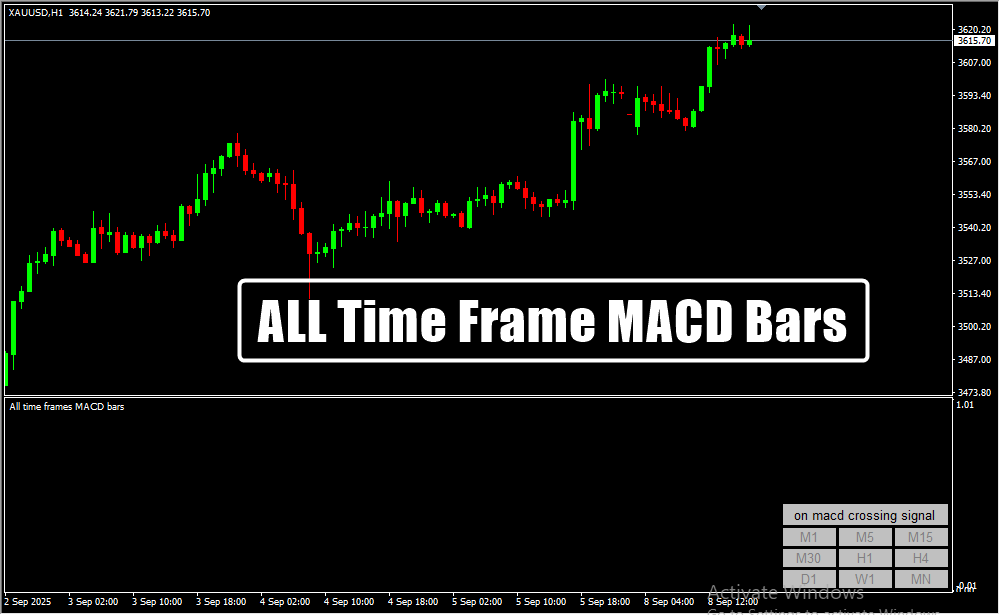
The All Time Frame MACD Bars Indicator for MT4 is a powerful and free Forex tool that helps traders analyze momentum and market trends across multiple timeframes. By combining the Moving Average Convergence Divergence (MACD) with a bar chart visualization, this indicator makes it easier to spot trend strength and potential reversals at a glance.
Instead of switching between different charts, traders can now view the MACD signals from several timeframes in one place, saving time and improving decision-making.
✅ How It Works
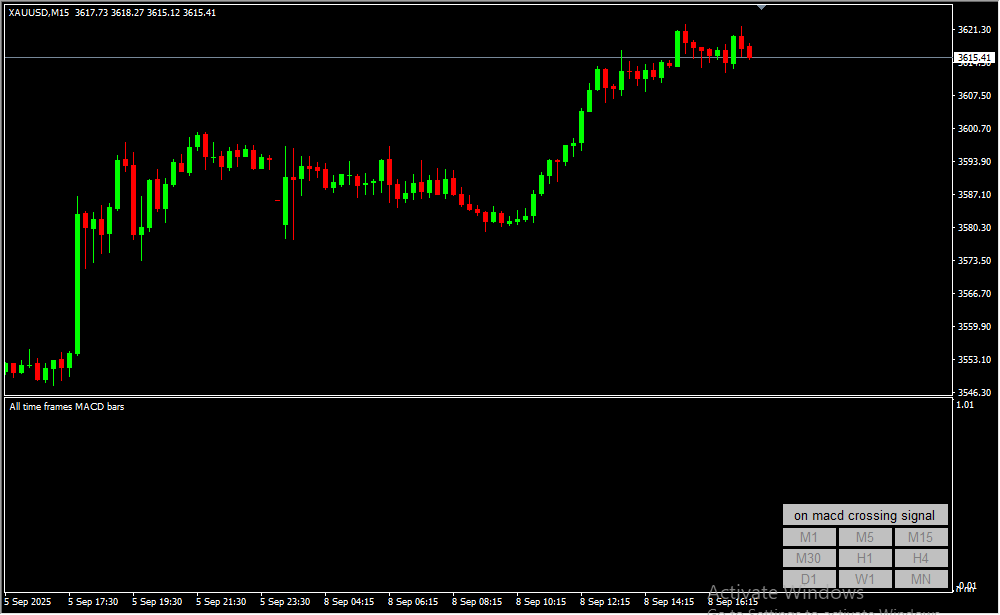
The indicator calculates the MACD histogram values on multiple timeframes and displays them as color-coded bars:
-
🟢 Green Bars – Indicate bullish momentum.
-
🔴 Red Bars – Indicate bearish momentum.
-
⚪ Neutral Bars – Suggest market indecision or consolidation.
By aligning signals across higher and lower timeframes, traders can confirm the strength of a trend before entering or exiting trades.
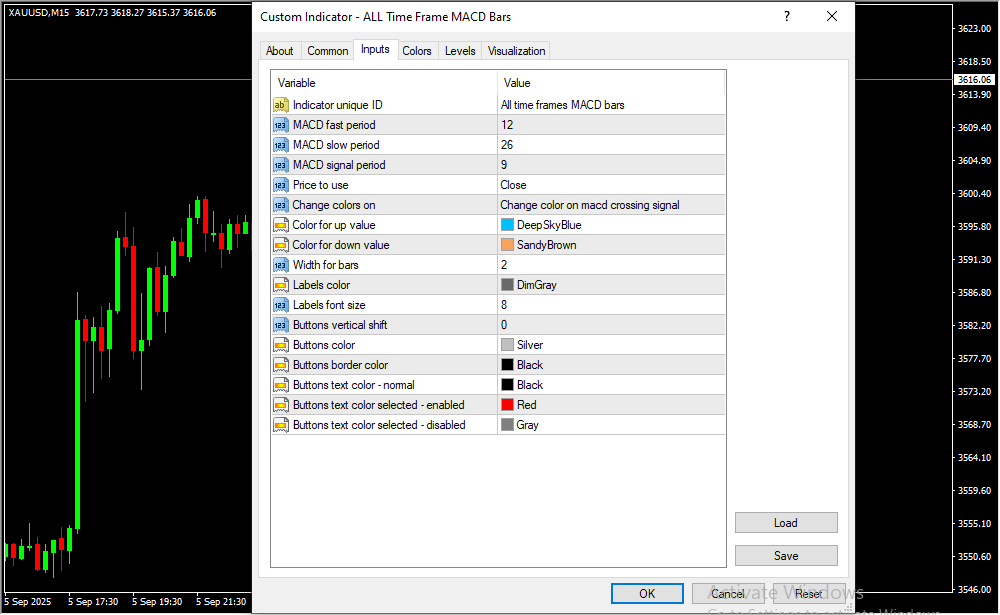
✨ Features of All Time Frame MACD Bars Indicator
-
📊 Multi-Timeframe MACD Display – Analyze momentum without chart switching.
-
🎯 Clear Visual Bars – Quickly spot buy/sell opportunities.
-
🔄 Customizable Settings – Adjust MACD parameters to fit your strategy.
-
⏳ Works on Any Timeframe – From 1-minute scalping to monthly analysis.
-
💻 User-Friendly & Free – Simple installation on the MT4 platform.
📌 Benefits for Traders
-
Confirm trend strength and direction across different timeframes.
-
Avoid false signals by validating lower timeframe setups with higher timeframe MACD.
-
Improve timing of entries and exits using momentum confirmation.
-
Save time by monitoring multiple MACD signals on a single chart.
The All Time Frame MACD Bars Indicator for MT4 is a must-have tool for traders who want to combine multi-timeframe trend confirmation with momentum analysis to improve accuracy and consistency in trading.
Risk Disclaimer
- TrendCharts.in and its associated products, services, software, and tools do not provide any offer or solicitation to buy or sell securities, futures, forex, commodities, or derivatives.
- We are not SEBI Registered Investment Advisors or Research Analysts.
- All materials are strictly for educational, informational, and paper trading & help in analysis purposes only.
- We do not provide advice for Real Money Trade, tips, buy/sell recommendations, or investment strategies.
- TrendCharts is solely involved in the development, sell, resale, and distribution of financial market software, datafeeds, indicators, scanners, and tools.
- All our offerings are intended for testing strategies and educational evaluation only—not for real-money trading.
- Users may utilize the software and tools for paper trading or strategy evaluation only.
- If users apply our offerings to actual trading (knowingly or unknowingly), TrendCharts.in or its stakeholders bear no responsibility for any profit or loss.
- Any such use is at the user’s sole discretion and risk.
- We explicitly disclaim liability for any financial loss, trading loss, or damages resulting from:
- Use of our software, tools, or services.
- Decisions made based on any charts, indicators, AFLs, data, or analysis from our products.
- All market data and content provided are subject to delays, inaccuracies, or errors.
- Past performance (actual or hypothetical) is not indicative of future results.
- Hypothetical or backtested performance may not reflect the impact of actual market conditions.
- Trading and investing involve substantial financial risk and can result in loss of capital beyond the initial investment.
- Users must use individual discretion and independent judgment while interpreting signals, strategies, or chart setups.
- Automated signals or scanners are tools for evaluation—not trading instructions.
- TrendCharts content does not account for personal financial conditions, goals, or investment profile.
- Before making any financial decisions, consult with a licensed financial advisor or SEBI-registered professional.
- Do not rely solely on any information presented on our site for actual trades.
- Datafeeds and information may be delayed as per data vendor policies or exchange requirements.
- We do not guarantee the real-time accuracy, timeliness, or completeness of such data.
- No legal claim may be made against us or our data providers based on inaccuracies.
- Any user testimonials are individual opinions and may not represent the typical user experience.
- Hypothetical performance results involve inherent limitations and should not be relied upon for real-money decisions.
- All opinions, data, signals, and analyses shared on the website are subject to change without notice.
- TrendCharts reserves the right to modify tools, content, and services at its discretion.
- Our software or product names are for branding purposes only and do not imply any market prediction or financial guarantee.
- No claim is made regarding profitability from any software usage.
- All content—charts, indicators, tools, or data—is designed for testing, analysis, and learning.
- No real-money trading or investment recommendations are provided or supported.
 Final Note: Trading in financial markets is speculative and may not be suitable for all investors. TrendCharts.in provides various automatic signal setups for Paper Trading & help in Analysis, it is not a “black box” system to be used without careful evaluation. Users must apply their judgment in filtering automated setups, particularly in relation to broader market trends. All trading decisions are solely the responsibility of the individual trader. Trading and investing involve risks, and losses are inevitable, So Kindly use only risk capital and never invest money you cannot afford to lose.
 Always remember
 my 3R Rule
 : If the money
 is yours then, risk
 , reward
 and regret
 are solely yours.