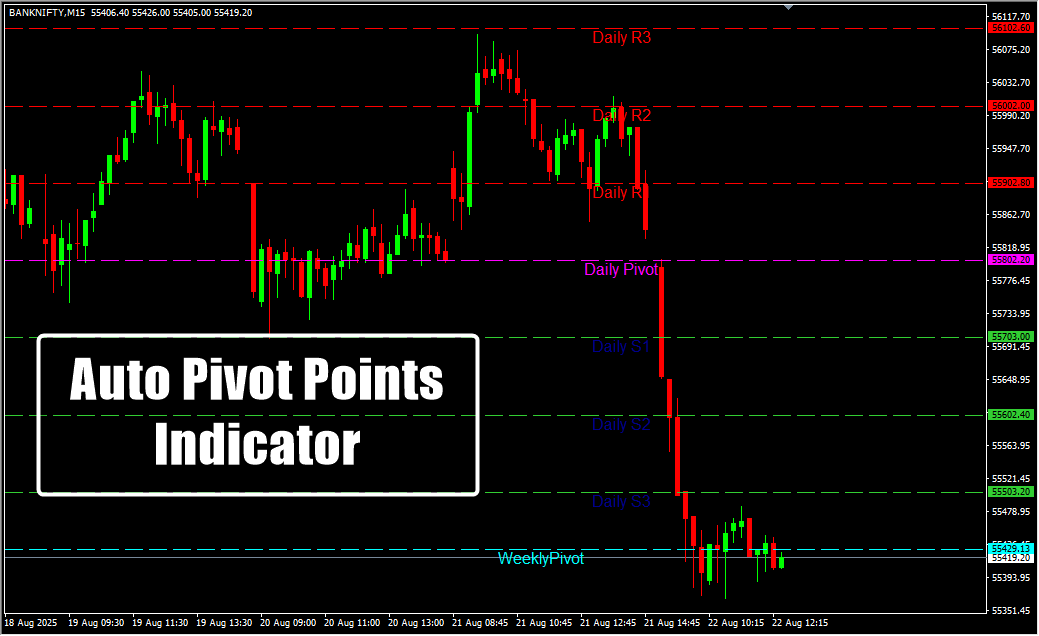
📌 Auto Pivot Points Indicator MT4 is a powerful tool designed to plot essential pivot points directly on the chart. Here’s what makes it valuable:
-
📈 Accurate Pivot Calculation – Calculates pivot points using previous day’s, week’s, and month’s high, low, and close prices.
-
🔍 Comprehensive Levels – Displays central pivot, support (S1–S4), and resistance (R1–R4) levels.
-
🔄 Multi-Timeframe Adaptability – Works on any timeframe, from M1 to MN.
-
🌍 Universal Pair Support – Compatible with all currency pairs and instruments.
-
🛠 User-Friendly for All Traders – Ideal for beginners and experienced professionals.
-
⚡ Enhances Trading Strategies – Assists in identifying key price zones for entries and exits.
-
📊 Seamless Integration – Fits into any forex trading system or strategy.
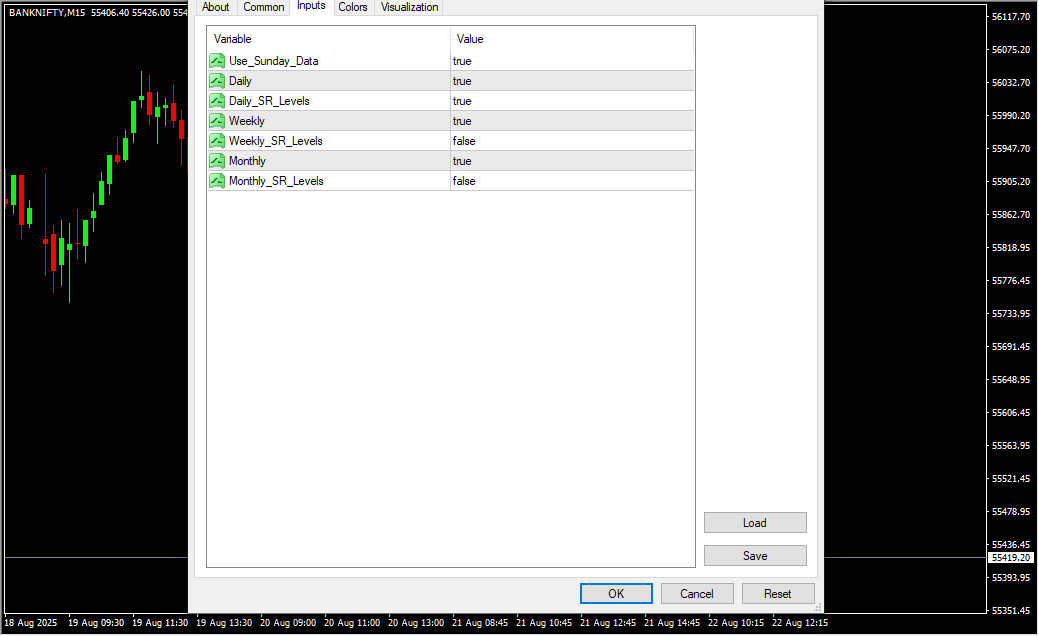
Use Sunday Data
Include or exclude Sunday price data when calculating pivot points. Setting this to true ensures Sunday’s data is used in calculations, which can slightly affect pivot levels for instruments trading on weekends.
Daily
Enable or disable the calculation of daily pivot points. When set to true, the indicator will calculate pivot levels based on the previous day’s high, low, and close.
Daily S/R Levels
Show or hide daily support and resistance levels on the chart. This provides short-term traders with intraday pivot zones for decision-making.
Weekly
Enable or disable the calculation of weekly pivot points. When active, the indicator uses the previous week’s price data to determine pivot levels suitable for swing trading.
Weekly S/R Levels
Display or hide weekly support and resistance levels. These levels help identify major zones for medium-term market trends.
Monthly
Enable or disable the calculation of monthly pivot points. This setting uses the previous month’s data for determining pivot levels, providing guidance for longer-term positions.
Monthly S/R Levels
Show or hide monthly support and resistance levels on the chart. These zones are essential for identifying long-term support and resistance areas.
ExtFormula
Select the pivot point calculation formula. Common options include Standard, Fibonacci, Camarilla, or Woodie’s formulas, each providing a different approach for calculating pivot levels.
ExtHowManyDays
Specify the number of past days the indicator should use when displaying historical pivot points on the chart.
ExtDraw
Enable or disable the drawing of pivot levels on the chart. When set to true, the indicator will plot pivot lines for better visualization.
StepBack
Define how many bars or periods the calculation should step back from the current candle when determining pivot points. Useful for backtesting.
periodtotake
Set the number of periods to use for pivot point calculations, providing flexibility for custom time-based calculations.
SomeVar
Custom variable for advanced adjustments. It can be used to fine-tune the indicator’s behavior according to specific trading strategies.
Va
Represents a value adjustment or multiplier applied within the calculation. This setting helps in scaling the pivot levels if required.
Multiplier
Apply a multiplication factor to adjust the distance of support and resistance levels from the main pivot point. Useful for aggressive or conservative trading approaches.
Nbr_Periods
Indicates the number of periods the indicator should consider for its calculation logic. Adjusting this changes the amount of historical data included.
Lb
Set the look-back length for pivot points and S/R levels. A higher value considers more historical data, which may smooth out levels but reduce responsiveness to recent price changes.
Risk Disclaimer
- TrendCharts.in and its associated products, services, software, and tools do not provide any offer or solicitation to buy or sell securities, futures, forex, commodities, or derivatives.
- We are not SEBI Registered Investment Advisors or Research Analysts.
- All materials are strictly for educational, informational, and paper trading & help in analysis purposes only.
- We do not provide advice for Real Money Trade, tips, buy/sell recommendations, or investment strategies.
- TrendCharts is solely involved in the development, sell, resale, and distribution of financial market software, datafeeds, indicators, scanners, and tools.
- All our offerings are intended for testing strategies and educational evaluation only—not for real-money trading.
- Users may utilize the software and tools for paper trading or strategy evaluation only.
- If users apply our offerings to actual trading (knowingly or unknowingly), TrendCharts.in or its stakeholders bear no responsibility for any profit or loss.
- Any such use is at the user’s sole discretion and risk.
- We explicitly disclaim liability for any financial loss, trading loss, or damages resulting from:
- Use of our software, tools, or services.
- Decisions made based on any charts, indicators, AFLs, data, or analysis from our products.
- All market data and content provided are subject to delays, inaccuracies, or errors.
- Past performance (actual or hypothetical) is not indicative of future results.
- Hypothetical or backtested performance may not reflect the impact of actual market conditions.
- Trading and investing involve substantial financial risk and can result in loss of capital beyond the initial investment.
- Users must use individual discretion and independent judgment while interpreting signals, strategies, or chart setups.
- Automated signals or scanners are tools for evaluation—not trading instructions.
- TrendCharts content does not account for personal financial conditions, goals, or investment profile.
- Before making any financial decisions, consult with a licensed financial advisor or SEBI-registered professional.
- Do not rely solely on any information presented on our site for actual trades.
- Datafeeds and information may be delayed as per data vendor policies or exchange requirements.
- We do not guarantee the real-time accuracy, timeliness, or completeness of such data.
- No legal claim may be made against us or our data providers based on inaccuracies.
- Any user testimonials are individual opinions and may not represent the typical user experience.
- Hypothetical performance results involve inherent limitations and should not be relied upon for real-money decisions.
- All opinions, data, signals, and analyses shared on the website are subject to change without notice.
- TrendCharts reserves the right to modify tools, content, and services at its discretion.
- Our software or product names are for branding purposes only and do not imply any market prediction or financial guarantee.
- No claim is made regarding profitability from any software usage.
- All content—charts, indicators, tools, or data—is designed for testing, analysis, and learning.
- No real-money trading or investment recommendations are provided or supported.
 Final Note: Trading in financial markets is speculative and may not be suitable for all investors. TrendCharts.in provides various automatic signal setups for Paper Trading & help in Analysis, it is not a “black box” system to be used without careful evaluation. Users must apply their judgment in filtering automated setups, particularly in relation to broader market trends. All trading decisions are solely the responsibility of the individual trader. Trading and investing involve risks, and losses are inevitable, So Kindly use only risk capital and never invest money you cannot afford to lose.
 Always remember
 my 3R Rule
 : If the money
 is yours then, risk
 , reward
 and regret
 are solely yours.