 Key Features:
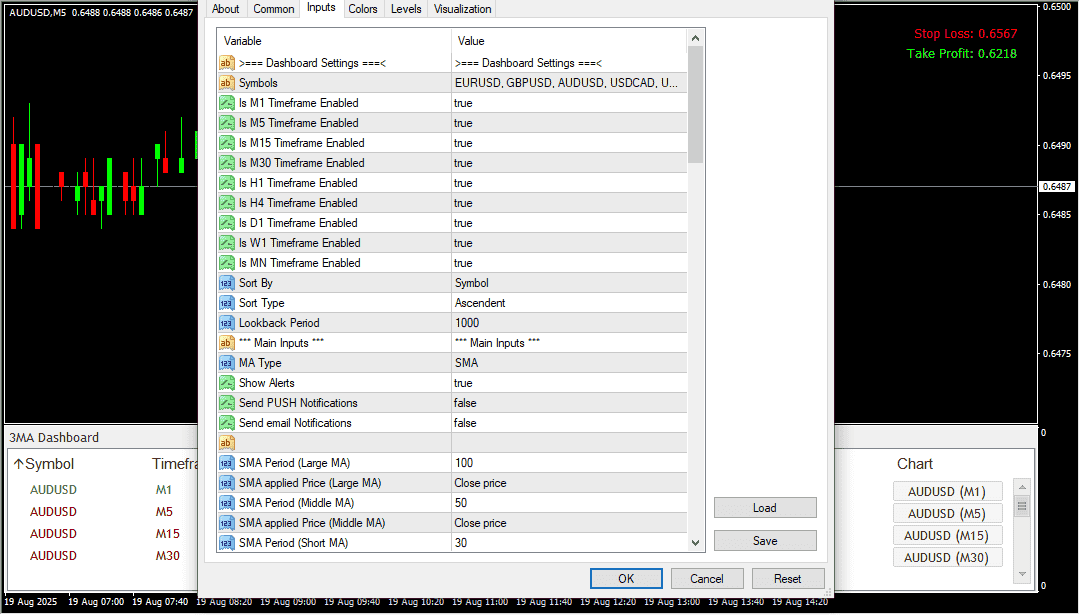
 Supports 10+ MA Types
SMA, EMA, HMA, TEMA, KAMA, SMMA, LWMA, DEMA, JMA, LSMA.
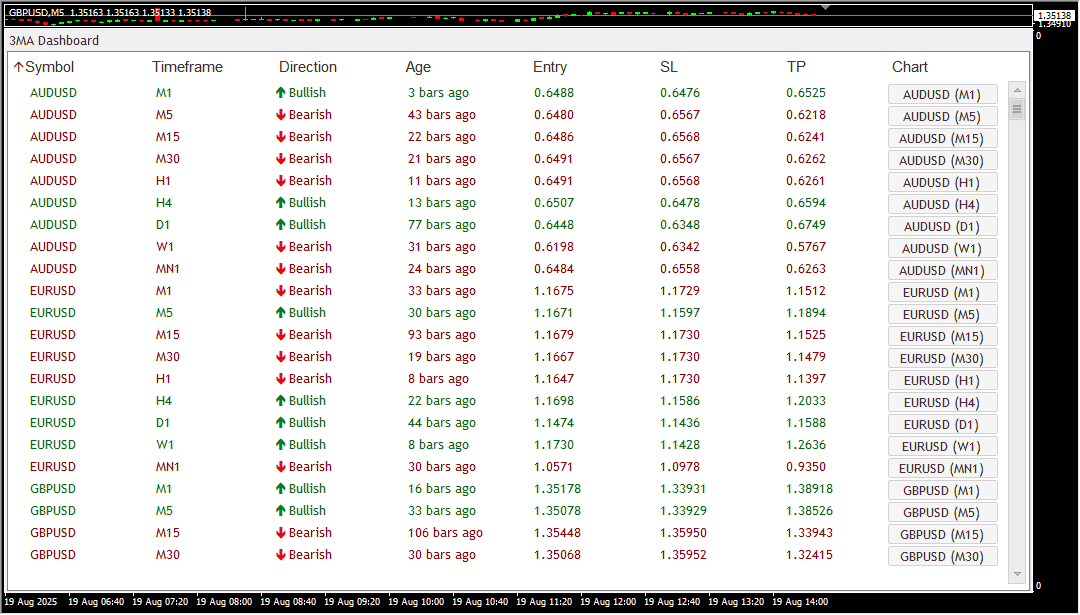
 Multi-Script & Timeframe Scanning
Monitor multiple instruments across timeframes from 1-Minute to 1-Month simultaneously.
 Instant Crossover Alerts
Know immediately when and where a moving average crossover happens—no manual checking.
 Detect Market Turning Points
Identify potential trend reversals using triple moving average crossover logic.
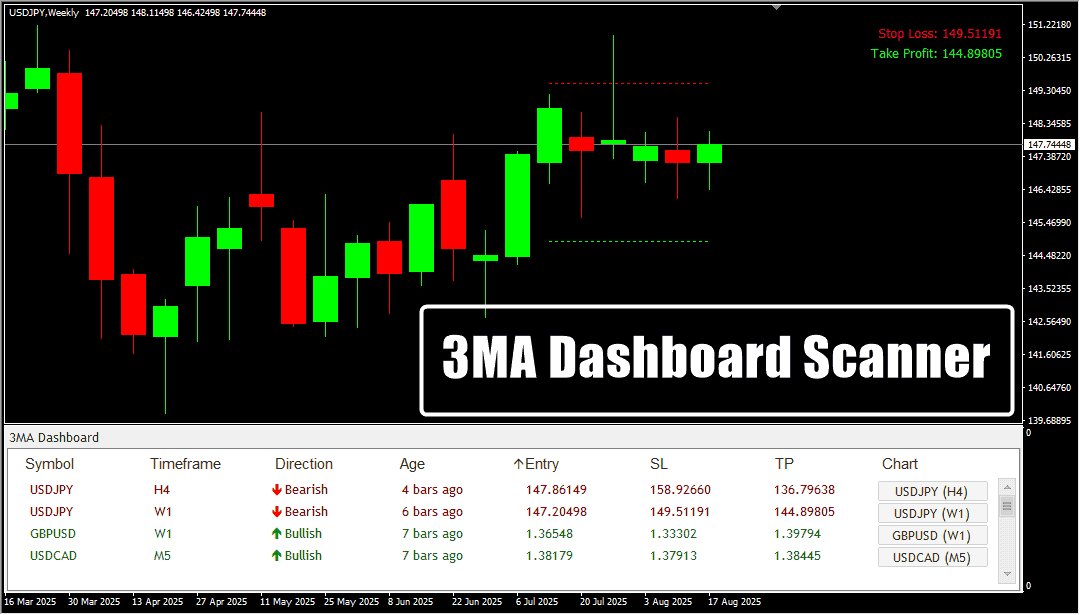
 Unified Real-Time Dashboard
View all active signals in a single, clean, and interactive dashboard.
 Automated Scanning Engine
Saves time by continuously scanning across symbols without manual input.
 One-Click Chart Access
Open the relevant chart and signal directly from the dashboard.
 Real-Time Alerts
Get notified via pop-up, sound, email, or push when a new signal forms.
 Smart Sorting & Filtering
Filter signals by symbol, timeframe, direction, signal age, or MA type.
Risk Disclaimer
- TrendCharts.in and its associated products, services, software, and tools do not provide any offer or solicitation to buy or sell securities, futures, forex, commodities, or derivatives.
- We are not SEBI Registered Investment Advisors or Research Analysts.
- All materials are strictly for educational, informational, and paper trading & help in analysis purposes only.
- We do not provide advice for Real Money Trade, tips, buy/sell recommendations, or investment strategies.
- TrendCharts is solely involved in the development, sell, resale, and distribution of financial market software, datafeeds, indicators, scanners, and tools.
- All our offerings are intended for testing strategies and educational evaluation only—not for real-money trading.
- Users may utilize the software and tools for paper trading or strategy evaluation only.
- If users apply our offerings to actual trading (knowingly or unknowingly), TrendCharts.in or its stakeholders bear no responsibility for any profit or loss.
- Any such use is at the user’s sole discretion and risk.
- We explicitly disclaim liability for any financial loss, trading loss, or damages resulting from:
- Use of our software, tools, or services.
- Decisions made based on any charts, indicators, AFLs, data, or analysis from our products.
- All market data and content provided are subject to delays, inaccuracies, or errors.
- Past performance (actual or hypothetical) is not indicative of future results.
- Hypothetical or backtested performance may not reflect the impact of actual market conditions.
- Trading and investing involve substantial financial risk and can result in loss of capital beyond the initial investment.
- Users must use individual discretion and independent judgment while interpreting signals, strategies, or chart setups.
- Automated signals or scanners are tools for evaluation—not trading instructions.
- TrendCharts content does not account for personal financial conditions, goals, or investment profile.
- Before making any financial decisions, consult with a licensed financial advisor or SEBI-registered professional.
- Do not rely solely on any information presented on our site for actual trades.
- Datafeeds and information may be delayed as per data vendor policies or exchange requirements.
- We do not guarantee the real-time accuracy, timeliness, or completeness of such data.
- No legal claim may be made against us or our data providers based on inaccuracies.
- Any user testimonials are individual opinions and may not represent the typical user experience.
- Hypothetical performance results involve inherent limitations and should not be relied upon for real-money decisions.
- All opinions, data, signals, and analyses shared on the website are subject to change without notice.
- TrendCharts reserves the right to modify tools, content, and services at its discretion.
- Our software or product names are for branding purposes only and do not imply any market prediction or financial guarantee.
- No claim is made regarding profitability from any software usage.
- All content—charts, indicators, tools, or data—is designed for testing, analysis, and learning.
- No real-money trading or investment recommendations are provided or supported.
 Final Note: Trading in financial markets is speculative and may not be suitable for all investors. TrendCharts.in provides various automatic signal setups for Paper Trading & help in Analysis, it is not a “black box” system to be used without careful evaluation. Users must apply their judgment in filtering automated setups, particularly in relation to broader market trends. All trading decisions are solely the responsibility of the individual trader. Trading and investing involve risks, and losses are inevitable, So Kindly use only risk capital and never invest money you cannot afford to lose.
 Always remember my 3R Rule
 : If the money
 is yours then, risk
 , reward
 and regret
 are solely yours.
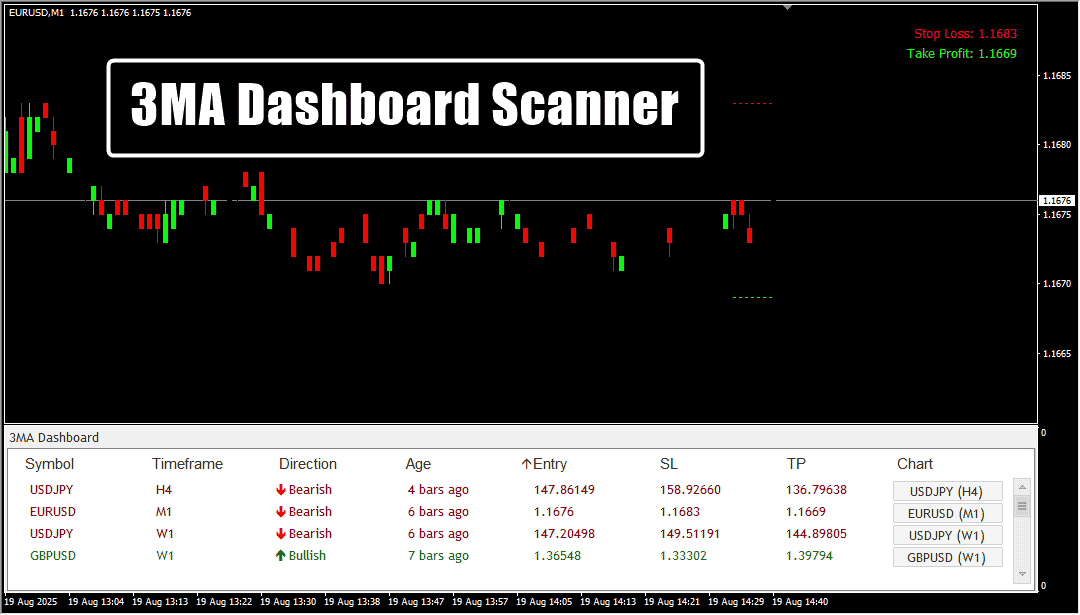
 3MA Dashboard Scanner tracks real-time moving average.
 Works on all timeframes — from 1-Minute to Monthly charts.
 Clean, interactive dashboard — view all signals in one place.
 Real-time alerts — via pop-up, sound, email, or mobile push.
 Fully customizable — set MA types, lengths, colors, and alerts.
 Fast, accurate, and user-friendly.
Reviews
There are no reviews yet.